Fig. 8
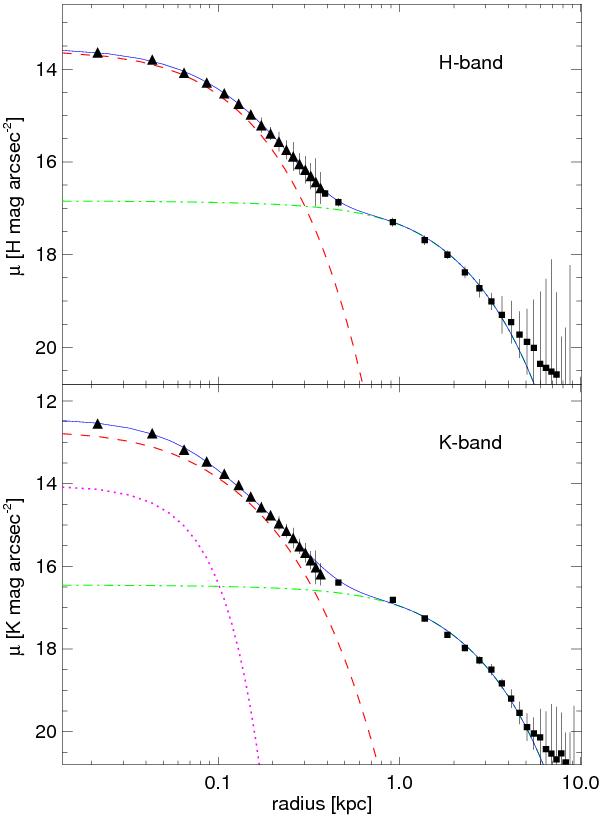
Brightness profile of IRAS 01072+4954 obtained by combining the NIFS (triangles) and 2MASS (squares) data. The H-band profile is shown in the upper panel and K-band at the bottom. In both cases, the dashed line corresponds to a Sersic profile fitted to the bulge, and the dash-dotted line to an exponential function that fits the disk component. The solid lines show the overall fits. The dotted line in the lower panel represents the AGN + hot dust contribution fixed to the 25% of the inner r ≈ 75 pc emission, based on the results presented in Sect. 3.4. The photometric parameters of the profiles in both bands are listed in Table 3.
Current usage metrics show cumulative count of Article Views (full-text article views including HTML views, PDF and ePub downloads, according to the available data) and Abstracts Views on Vision4Press platform.
Data correspond to usage on the plateform after 2015. The current usage metrics is available 48-96 hours after online publication and is updated daily on week days.
Initial download of the metrics may take a while.