Fig. 5
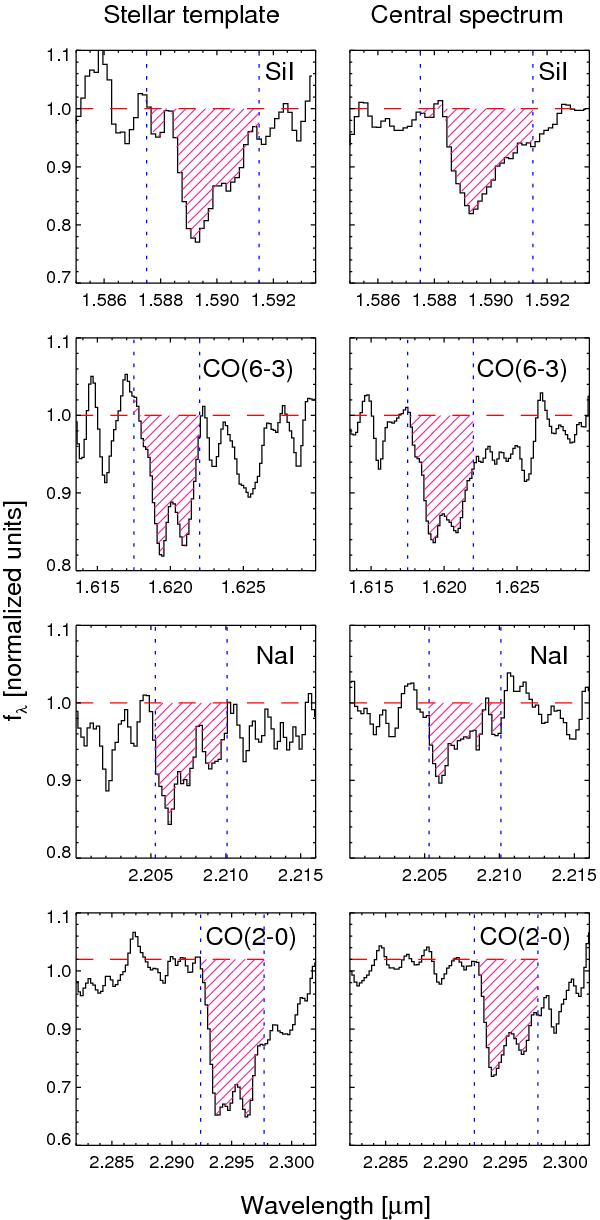
Absorption lines in the stellar template spectrum (left) and the spectrum extracted at the center (right) of IRAS 01072+4954. The spectra are normalized to the continuum level, which is shown as a dashed line in each case. The vertical dotted lines mark the limits of the integration regions, and shaded areas the equivalent widths. The measured values are reported in Table 2. From top to bottom the absorption features are, as indicated, Si i, CO (6−3), Na i and CO (2−0).
Current usage metrics show cumulative count of Article Views (full-text article views including HTML views, PDF and ePub downloads, according to the available data) and Abstracts Views on Vision4Press platform.
Data correspond to usage on the plateform after 2015. The current usage metrics is available 48-96 hours after online publication and is updated daily on week days.
Initial download of the metrics may take a while.