| Issue |
A&A
Volume 544, August 2012
|
|
|---|---|---|
| Article Number | A17 | |
| Number of page(s) | 17 | |
| Section | Stellar structure and evolution | |
| DOI | https://doi.org/10.1051/0004-6361/201219161 | |
| Published online | 19 July 2012 | |
The peculiar isolated neutron star in the Carina Nebula
Deep XMM-Newton and ESO-VLT observations of 2XMM J104608.7-594306⋆
1 Leibniz-Institut für Astrophysik Potsdam (AIP), An der Sternwarte 16, 14482 Potsdam, Germany
e-mail: This email address is being protected from spambots. You need JavaScript enabled to view it.
2 CNRS, Université de Strasbourg, Observatoire Astronomique, 11 rue de l’Université, 67000 Strasbourg, France
3 Universitá di Padova, Dipartimento di Fisica e Astronomia, via Marzolo 8, 35131 Padova, Italy
4 Mullard Space Science Laboratory, University College London, Holmbury St. Mary, Dorking, Surrey, RH5 6NT, UK
5 Netherlands Foundation for Research in Astronomy, Postbus 2, 7990 AA, Dwingeloo, The Netherlands
6 Universitá dell’Insubria, Dipartimento di Fisica e Matematica, via Valleggio 11, 22100 Como, Italy
7 Sternberg Astronomical Institute, Lomonosov Moscow State University, Universitetskii pr. 13, 119991 Moscow, Russia
8 Instituto de Astronomia, Geofísica e Ciências Atmosféricas, Universidade de São Paulo, R. do Matão 1226, 05508-090 São Paulo, Brazil
Received: 2 March 2012
Accepted: 7 May 2012
Abstract
While fewer in number than the dominant rotation-powered radio pulsar population, peculiar classes of isolated neutron stars (INSs) – which include magnetars, the ROSAT-discovered “Magnificent Seven” (M7), rotating radio transients (RRATs), and central compact objects in supernova remnants (CCOs) – represent a key element in understanding the neutron star phenomenology. We report the results of an observational campaign to study the properties of the source 2XMM J104608.7-594306, a newly discovered thermally emitting INS. The evolutionary state of the neutron star is investigated by means of deep dedicated observations obtained with the XMM-Newton Observatory, the ESO Very Large Telescope, as well as publicly available γ-ray data from the Fermi Space Telescope and the AGILE Mission. The observations confirm previous expectations and reveal a unique type of object. The source, which is likely within the Carina Nebula (NH = 2.6 × 1021 cm-2), has a spectrum that is both thermal and soft, with kT∞ = 135 eV. Non-thermal (magnetospheric) emission is not detected down to 1% (3σ, 0.1–12 keV) of the source luminosity. Significant deviations (absorption features) from a simple blackbody model are identified in the spectrum of the source around energies 0.6 keV and 1.35 keV. While the former deviation is likely related to a local oxygen overabundance in the Carina Nebula, the latter can only be accounted for by an additional spectral component, which is modelled as a Gaussian line in absorption with EW = 91 eV and σ = 0.14 keV (1σ). Furthermore, the optical counterpart is fainter than mV = 27 (2σ) and no γ-ray emission is significantly detected by either the Fermi or AGILE missions. Very interestingly, while these characteristics are remarkably similar to those of the M7 or the only RRAT so far detected in X-rays, which all have spin periods of a few seconds, we found intriguing evidence of very rapid rotation, P = 18.6 ms, at the 4σ confidence level. We interpret these new results in the light of the observed properties of the currently known neutron star population, in particular those of standard rotation-powered pulsars, recycled objects, and CCOs. We find that none of these scenarios can satisfactorily explain the collective properties of 2XMM J104608.7-594306, although it may be related to the still poorly known class of Galactic anti-magnetars. Future XMM-Newton data, granted for the next cycle of observations (AO11), will help us to improve our currentobservational interpretation of the source, enabling us to significantly constrain the rate of pulsar spin down.
Key words: stars: neutron / X-rays: individuals: 2XMM J104608.7-594306 / X-rays: individuals: 1RXS J141256.0+792204 / X-rays: individuals: RRAT J1819-1458
Based on observations obtained with XMM-Newton, an ESA science mission with instruments and contributions directly funded by ESA Member States and NASA (Target 2XMM J104608.7-594306, obsid 0650840101). Optical observations were performed at the European Southern Observatory, Paranal, Chile, under programme IDs 382.D-0687(A) and 385.D-0209(A).
© ESO, 2012
1. Introduction
A major outcome of the ROSAT mission was the discovery of a group of seven radio-quiet thermally emitting isolated neutron stars (INSs), which were originally identified serendipitously as soft, bright X-ray sources with no obvious optical counterparts. They share a rather well-defined set of properties that have never been encountered together in previously known classes of INSs, and have been nicknamed the “Magnificent Seven” (M7, for short; see Haberl 2007; Kaplan 2008; Turolla 2009, for reviews).
Relative to standard (rotation-powered) radio pulsars, these INSs rotate slower (P ~ 10 s), have thermal X-ray luminosities higher than their spin-down power, and stronger magnetic fields (B ≳ 1013 G, as inferred from timing measurements as well as from the broad absorption lines in their X-ray spectra; see Kaplan & van Kerkwijk 2011, and references therein). The M7 display neither persistent nor transient radio emission to a rather sensitive limiting flux (Kondratiev et al. 2009) and are unassociated with supernova remnants. Proper motion studies (Motch et al. 2009, and references therein) show that they are cooling, middle-aged neutron stars (ages 105 to 106 yr), probably born in the nearby OB associations of the Gould Belt. Their proximity (few hundred parsecs; Posselt et al. 2007; van Kerkwijk & Kaplan 2007) and the combination of strong thermal radiation and absence of significant magnetospheric activity make them ideal targets for testing surface emission models, deriving radii and constraining the equation of state of neutron star matter. Unfortunately, the current lack of understanding of the surface composition, magnetic field, and temperature distributions have limited any definite conclusion so far (see e.g. Kaplan et al. 2011).
Growing evidence relates the M7 to other peculiar groups of INSs, in particular the magnetar candidates, anomalous X-ray pulsars, and soft γ-ray repeaters (AXPs and SGRs, see e.g. Mereghetti 2008, for a review), and the rotating radio transients (RRATs, McLaughlin et al. 2006; Keane & McLaughlin 2011). The long spin periods, bright thermal emission, and intense magnetic fields suggest that some of the M7 might have evolved from the younger and more energetic magnetar objects (e.g. Heyl & Kulkarni 1998; Popov et al. 2010). Crustal heating by means of magnetic field decay seems to play an important role in the thermal evolution of neutron stars with B ≳ 5 × 10¹³ G, since a correlation between B and kT is observed (e.g. Aguilera et al. 2008; Pons et al. 2009; Kaplan & van Kerkwijk 2009). On the other hand, the discovery of RRATs is intriguing since these sources have so far manifested themselves in a variety of ways. While many, in spite of their transient nature, display timing properties that cannot be distinguished from those of the bulk of normal radio pulsars, several RRATs with longer spin periods and higher magnetic fields occupy a region of the P − Ṗ diagram that is devoid of normal pulsars and close to that populated by the M7. Moreover, the most active source among the known sample is the highly magnetized RRAT J1819-1458, the only one that has so far been detected in X-rays (Reynolds et al. 2006; McLaughlin et al. 2007; Kaplan et al. 2009)1. Very interestingly, the X-ray source was found to exhibit a spectrum that although hotter and more absorbed is remarkably similar to those of the M7. Unusual timing behaviour following glitches detected in the radio indicates that this source might also have evolved from a magnetar (Lyne et al. 2009).
It is remarkable that a group of very similar sources, displaying at the same time unique properties that are extremely different from those of standard radio pulsars, are all detected in the very local solar vicinity. Taking into account that the M7 represent about half of all young (younger than 3 Myr) INSs known within ~1 kpc (Popov et al. 2003), they could be just the tip of an iceberg of a largely hidden population of stellar remnants. Both the poorly constrained populations of RRATs and thermally emitting INSs are indeed estimated at present to outnumber ordinary radio pulsars by factors of one to three (e.g. Keane et al. 2010), whereas the latter alone are sufficient to account for the total number of past Galactic core-collapse supernovae. Therefore, to avoid “superpopulating” the Galaxy with unrelated neutron stars, it is necessary to invoke links between the several subgroups, which may be either selection effects (i.e. the same object appears differently to the observer due to viewing biases) or actual evolutionary relations.
1.1. The source 2XMM J104608.7-594306
Radio-quiet INSs are extremely elusive and difficult to detect. For several years, considerable efforts have been devoted to discovering new sources similar to the M7 (e.g. Rutledge et al. 2003; Chieregato et al. 2005; Agüeros et al. 2006; Turner et al. 2010; Agüeros et al. 2011). These involve cross-correlating X-ray sources – often with large positional errors – with a large number of catalogued objects at other wavelengths, and dealing appropriately with the level of sample contamination by other classes of X-ray emitters. In spite of these searches, only two radio-quiet thermally emitting INSs have been positively identified to date since the ROSAT era, namely Calvera (1RXS J141256.0+792204) and 2XMM J104608.7-594306 (hereafter J1046).
Calvera is a relatively bright ROSAT source, which was originally identified as a likely compact object based on its large X-ray-to-optical flux ratio (Rutledge et al. 2008). The distance to the source is poorly constrained. Its interpretation as a cooling INS (with a similar size of emission radius as the M7) has always met with difficulties, since its high Galactic latitude and hot temperature (kT ~ 200 eV) would either require a very high spatial velocity to explain its current position well above the Galactic plane or point to a non-standard cooling or re-heating process. Alternatively, if Calvera’s progenitor were a high-velocity runaway star, it might have been born away from the Galactic plane (Posselt et al. 2008). Recent multiwavelength investigations by Zane et al. (2011) confirmed the radio-quiet nature of the source and most notably revealed the neutron star’s very short spin period of P ~ 59 ms, which was later also apparently detected in γ-rays with data from the Fermi Large Area Telescope (LAT, Atwood et al. 2009). The nature of Calvera however remains unclear, especially after Halpern (2011) called the γ-ray detection into question, leaving the spin-down rate of the source far more poorly constrained (see Sect. 5).
We previously reported the results of a programme to identify new thermally emitting INSs in the XMM-Newton catalogue of serendipitous X-ray sources (Pires et al. 2009a). The X-ray brightest INS candidates resulting from our search have been the scope of succesful proposals carried out over the past four years in the optical with the 8.1 m European Southern Observatory Very Large Telescope (ESO-VLT), the two 8.4 m Large Binocular Telescope (LBT), and the 4.1 m Southern Observatory for Astrophysical Research (SOAR). These deep optical investigations permitted the discovery of a new thermally emitting INS, J1046 (Pires et al. 2009b, hereafter Paper I).
As expected for a cooling INS, J1046 is characterised by a soft blackbody-like emission, stable observed flux over a long timescale, a very high X-ray-to-optical flux ratio, and no radio counterpart in the Parkes Multibeam Pulsar Survey (which has a sensitivity of 0.14 mJy for a canonical pulsar). The column density is consistent with the source being located within the Carina Nebula, at a distance of 2 kpc (Paper I). This giant H II region is indeed likely to harbour unidentified cooling neutron stars, which are the faint analogues of those produced in other close-by regions of intensive star formation (Posselt et al. 2008, see their Fig. 7).
To investigate its properties and evolutionary state, we have ongoing dedicated projects in the optical and X-rays to observe this source. We report here the results of an observational campaign with XMM-Newton and ESO-VLT. The paper is structured as follows: in Sects. 2 and 3, we describe the X-ray and optical follow-up observations, together with detailed analysis and results. A search for pulsations in Fermi-LAT and AGILE (Tavani et al. 2009) data is described in Sect. 4. The summary and discussion of the results are in Sect. 5. Finally, our conclusions are given in Sect. 6.
Instrumental configuration and duration of the EPIC scientific exposures of the XMM-Newton observation of 2XMM J104608.7-594306.
2. XMM-Newton observations
Being located at an angular distance of ~8.5′ from the well-studied binary system Eta Carinae (η Car), J1046 has been detected on many occasions by XMM-Newton and Chandra. Unfortunately, in most observations, conditions were far from optimal, given the source’s large off-axis angles, ~9′ on average, and short effective exposure times, usually less than 15 ks (see Paper I, for details)2. We were granted XMM-Newton time (90 ks, AO9) to help us to characterize the source spectral energy distribution and search for pulsations.
2.1. Observations and data reduction
Observations were carried out on 2010 December 6, for a total exposure time of 90.917 ks. All instruments on-board XMM-Newton (Jansen et al. 2001) were active during the observation. Table 1 contains information on the scientific exposures and instrumental setup of the EPIC pn (Strüder et al. 2001) and MOS (Turner et al. 2001) detectors.
The EPIC cameras operated in small window (SW) mode with thin filters. In this configuration, pn and MOS provide a time resolution of 6 ms and 0.3 s, respectively; owing to the more frequent readout, the nominal exposures are shorter by factors of 0.71 and 0.975 (corresponding to deadtimes of 29% and 2.5%). For pn, only the 63 × 64 pixels (4.3′ × 4.3′) of CCD 4 are read out. For MOS, the central 100 × 100 pixel area (1.8′ × 1.8′) of the inner CCD operates with a higher time resolution, while the outer chips are read out normally.
The MOS cameras experienced sporadic full scientific buffers during the first 35 ks of the observation, alternating very short scientific exposures, of typical durations of shorter than half a kilosecond, with periods where the cameras operated in the so-called “counting mode”, lasting between 2.6 ks and 6.8 ks. In this mode, no transmission of information for individual X-ray events occurs. As a result, the effective observing time is considerably shorter for MOS. The reason for the abnormal operation of the MOS detectors is the presence of the X-ray bright η Car in one of the peripheral MOS CCDs, which are used to monitor the radiation level during the observation under the assumption that no bright sources are present. The MOS exposures were unfortunately interrupted and restarted several times until the origin of the high count-rate level could be identified (Gonzalez-Riestra, priv. comm.).
Data reduction was performed with SAS 11 (xmmsas-20110223-1801) by applying standard procedure and using the latest calibration files. MOS exposures U008 and pn S003 were processed using the EPIC meta tasks emchain and epchain, respectively, applying default corrections. We ensured that the pn event files were clean of unrecognised time jumps (i.e. those uncorrected by standard SAS processing).
No background flares were registered during the 90 ks (last 55 ks) of the pn (MOS) observations. The effective observing times were therefore only reduced by the cameras’ livetime in SW mode: 63.25 ks for pn and 53.4 ks for MOS. We note that although optical loading (due to unblocked optical photons from η Car and other bright OB stars in the field-of-view) is obviously present at η Car’s position in the MOS images, out-of-time events or charge transfer efficiency (CTE) alteration are unimportant at the position of the target at aimpoint, since η Car is not located on the same CCD as J1046 or along the readout direction (Ehle, priv. comm.).
For the analysis, we filtered the event lists to retain the pre-defined photon patterns with the highest quality energy calibration – single and double events for pn (pattern ≤ 4) and single, double, triple, and quadruple for MOS (pattern ≤ 12) – as well as to exclude bad CCD pixels and columns. Source photons were extracted from circular regions of radius 18″ (unless otherwise noted) centred on the position of the source (as given by emldetect for each camera; see Sect. 2.2). Background circular regions of size 50″ (pn) and 25″ (MOS) were defined off-source, on the same CCD as the target. Owing to the frequent readout of the pn in SW mode, detector noise dominates the low-energy count distribution. We therefore restricted the analysis of pn data to photons with energies between 0.3 keV and 2 keV (see however Sect. 2.3). For MOS, the energy band for the analysis is 0.15–2 keV.
The detected source count rates are 7.74(14), 1.66(6), and 1.90(6) ( × 10-2 s-1; pn, MOS1, and MOS2); these closely agree with the expectations of simulations (considering the source parameters as in Paper I). Using the SAS task epiclccorr, we created lightcurves for J1046, which were corrected for bad pixels, deadtime, exposure, and background counts. The statistics for these corrected lightcurves, binned into 900 s and 550 s (pn and MOS) intervals, show the 3σ upper limits for the rms fractional variation of 0.12, 0.30, and 0.25 for pn, MOS1, and MOS2, respectively. On the basis of the same lightcurves, the reduced  assuming a constant flux is 1.007 (pn, 100 d.o.f.), 0.979, and 1.067 (MOS1 and MOS2; 99 d.o.f.), corresponding to null-hypothesis probabilities of 46%, 51%, and 28%.
2.2. Source detection
To measure the position of J1046, we created images in the five XMM-Newton pre-defined energy bands, for each EPIC camera, and analysed them (individually and simultaneously) with the source-detection meta task edetect_chain. In Table 2, we list the source equatorial coordinates in each camera together with previous determinations based on Chandra and XMM-Newton (obsid 0311990101, with the highest signal-to-noise ratio) archival data.
The position of the source was found to be offset relative to previous determinations. By cross-correlating the list of (pipeline-processed) EPIC X-ray sources with those of optical (GSC2.3) objects lying within 17′ from J1046, we found offsets of −1.8″ in RA and 0.9″ in Dec, as well as a slight rotational offset of 0.013°, using the SAS task eposcorr and a number of 59 matches. The corrected source position, updated accordingly, is consistent with previous determinations (Table 2). We calculated the 1σ errors in the updated position by quadratically adding a systematic uncertainty of 0.35″ to the nominal errors computed by emldetect, which is the procedure adopted by the catalogue pipeline of XMM-Newton, based on correlations with optical catalogues.
Source parameters based on a maximum likelihood fitting are given in Table 3. The hardness ratios and corresponding errors were computed according to 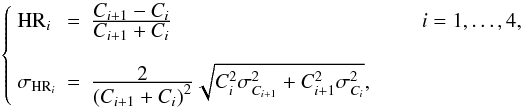 where Ci are counts in a given energy band and σCi are the corresponding errors. Owing to the low counts detected in energy bands 4 and 5 (above 2 keV), the errors in HR4 are too large; hence we only list in Table 3 the values of hardness ratios that can be constrained by the errors (HR1,2,3).
Source coordinates with 1σ errors.
Parameters of 2XMM J104608.7-594306, as extracted from the XMM-Newton AO9 observations.
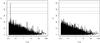 |
Fig. 1 Results of the |
2.3. Timing analysis
Previous X-ray observations of J1046 did not reveal pulsations to a poorly constraining 30% upper limit (3σ confidence level), in the 0.15–100 s period range (Paper I). Simulations showed that for an exposure time of 90 ks the EPIC cameras operating with the thin filter can collect enough photons to significantly (>4σ) detect pulsations from J1046 of periods in the range P = 0.6−1000 s, for pulsed fractions higher than ~10−15%. The time resolution of the EPIC cameras in SW mode allows us to search for pulsations with frequencies as high as 1.7 Hz – similar to those observed in both RRATs and the M7. The higher resolution of pn in SW mode also allows us to search for higher frequencies, up to 88 Hz, albeit with lower sensitivity.
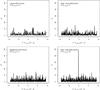 |
Fig. 2 Our |
For the timing analysis, we considered events with pattern 12 or lower. The times-of-arrival of the pn/MOS photons were converted from the local satellite to the solar system barycentric frame using the SAS task barycen and the source coordinates (Table 3). A  (Rayleigh) test (Buccheri et al. 1983) was used, which is appropriate when searching for smooth pulsations similar to those in the X-ray emission of thermally emitting INSs (in particular, four of the M7 show pulsed fractions, pf, lower than 10%).
We analysed the EPIC cameras together in the P = 0.6−10 000 s period range, by testing different energy bands and extraction region radii. Given the high noise of the pn camera at low energies and the energy-dependent signal-to-noise ratio (S/N), we performed searches testing energy intervals where we aimed to achieve the optimal compromise between sensitivity and source signal over background counts. More specifically, we defined energy bands where the S/N was both the highest, S/N > 5 (0.4–1.3 keV, ~4260–5890 pn events), and moderate, S/N > 3 (0.33–1.5 keV, ~4640–6500 pn events); we also extensively tested other energy configurations by varying the lower (ϵl) and upper (ϵu) ends of the energy band, ϵl between 0.2 keV and 1 keV and ϵu between 1.9 keV and 2.5 keV. The radii of the extraction regions were varied between 10″ and 25″ around the position of the source, as determined for each camera with emldetect (Table 2). To search for higher frequency pulsations, with periods as short as P = 0.0114 s, we restricted the analysis to the pn data, and tested different parameters (energy bands, extraction radii, and photon patterns).
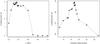 |
Fig. 3 Left. Significance of the |
The adopted step in frequency was 1 μHz when analysing EPIC and twice this value when running the test on pn, typically for a frequency range ~50 times broader. These values oversample the expected width of the peaks by a factor of nearly ten, warranting that a peak corresponding to a periodic signal is not missed. The number of statistically independent trials depends on the chosen frequency range of the search and the exposure time of the observation; typically it is ~105 for EPIC searches and between ~105 and 6 × 10⁶ when screening pn data.
In the frequency range where we are most sensitive to pulsations, namely periods P = 0.6–10 000 s (when the EPIC cameras are analysed together), no significant periodicities were found. The 3σ upper limit to the source pulsed fraction in this period range is 9.6%, considering the 0.3–2.5 keV energy band.
Very interestingly, extending the search to higher frequencies (pn data only), we found evidence of a periodicity at P ≡ P∗ = 18.640787(6) ms. The peak at frequency ν∗ = 53.645804(16) Hz has a maximum power of  and corresponds to a detection at 4σ (see below). The resulting periodogram can be seen in Fig. 1.
Across the entire frequency range and parameter space covered by our timing analysis, no other frequency had a power as high as  . The peak was also the strongest for searches conducted with different photon patterns and frequency resolution. We found that for low frequency resolution searches, with steps of 8–10 μHz, the exact frequency was missed and the power (although the highest in the search) is lower,
  . Best results were found when only single and double pn events were included in the search.
To investigate whether this signal is associated with unknown instrumental effects, we performed the same analysis on photons extracted from a few background regions, with roughly the same total number of counts as collected for J1046. We found that the maximum peaks (which occur at random frequencies) are always below the 1σ confidence level, considering the total frequency range of the analysis (P = 0.0114 − 1000 s and Δν = 87.72 Hz; see again Fig. 1). The corresponding power of statistics at P = P ∗ is also very low in the background regions,  ~ 6. Moreover, we looked for significant peaks around P = P ∗ in most recent observations of other INSs performed in SW mode – the 2009 observation of Calvera (obsid 0601180201) and the 2006 one of RRAT J1819-1458 (obsid 0406450201). Peaks detected at our reported frequency are weak in both cases,
  and
and  , as shown in Fig. 2.
Although the highest discovered in our search, the power (significance) of the statistics at P ∗ is sensitive both to the choice of energy band and the size of the extraction region (Fig. 3). In general, we found that potential pulsations from the source are likely to be smeared out by noise when the energy band is not restricted to below ~ 0.3 keV, where the background of the pn camera dominates. In particular, for searches with ϵl < 0.25 keV, the peak at P = P ∗ is below the 2σ confidence level (Fig. 3; left). On the other hand, when low energy photons are discarded and the lower end of the energy band is not too restrictive (i.e. ϵl is between 0.3 keV and 0.6 keV), the signal is always detected above the 3σ confidence level. The loss of sensitivity detected when ϵl is above 0.6 keV is due to the reduced number of counts (between 950 and 3750 counts in the 1 − 2.2 keV and 0.6–2.2 keV energy bands, respectively, compared to the more than 5000 counts in broader energy bands). The signal is not as sensitive to the upper end of the energy band, ϵu, and is strongest at 2.2 keV ( –50 for ϵu between 1.9 keV and 2.5 keV; ϵl = 0.36 keV). We note that by restricting ourselves to high-S/N energy bands (0.4–1.3 keV, S/N > 5 and 0.33–1.5 keV, S/N > 3), we obtain results that are no more reliable than more sensitive searches (i.e. with broader energy bands).
Our timing analysis carried out using photons extracted from circular regions with different radii revealed that the power varies steeply between 17″ and 20″, reaching its maximum at 18.85″ (Fig. 3; right). For the 0.36–2.2 keV energy band, the signal is always above 3σ for radii between 16″ and 20″. Other energy bands also show an optimal extraction radius at the same value, 18.85″.
For the best choices of energy band and extraction region radius as discussed above, the significance of the pulsed signal is 4σ, for Δν = 87.72 Hz and  independent trials (the probability of the measured periodicity being spurious is ~ 6.334 × 10⁻⁵). The corresponding pulsed fraction, defined as
 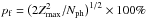 , where Nph are the total number of counts in the search, is ~ 14%. A pn lightcurve, folded at P ∗ and corrected for background counts and other effects, can be seen in Fig. 4. The pulse profile, as expected from the search, is fairly sinusoidal.
 |
Fig. 4 Background-subtracted light curve for pn, folded at the spin period P ∗ ~ 18.6 ms. The energy band is 0.35–2 keV and the size of the extraction region is 18.85″. |
2.4. Spectral analysis
Our analysis of archival data that serendipitously detected J1046 (Paper I) revealed a soft spectrum characterised by blackbody-like emission of an average temperature kT = 117 ± 14 eV, hydrogen column density NH = (3.5 ± 1.1) × 1021 cm-2, and stable observed flux of fX = 1.03(6) × 10-13 erg s-1 cm-2 (errors are at 3σ).
The analysis of AO9 data is based on source spectra extracted from a region of size 19″, together with respective response matrices and ancillary files for each of the EPIC cameras (created using the SAS tools rmfgen and arfgen). Background spectra were extracted from regions as described in Sect. 2.1. We limited the energy band of the pn camera to 0.3–2.2 keV, while the MOS cameras were analysed between 0.15 keV and 2.2 keV.
To increase the S/N and use standard χ2-minimization techniques in XSPEC 12.7.0, spectra were rebinned using the SAS task specgroup. The spectral bins were grouped according to a minimum S/N of three and we took care to oversample the instrument energy resolution at a given bin by less than a factor of three. Our preliminary analysis had shown that the inclusion of data from the MOS2 camera considerably worsens the spectral fits and biases the parameter determination; we therefore only considered the pn and MOS1 cameras, which were fitted simultaneously to more tightly constrain the spectral parameters.
To account for interstellar absorption, we adopted the photoelectric absorption model and elemental abundances of Wilms et al. (2000, tbabs in XSPEC. We note that the source spectral parameters in Paper I were derived by adopting a different abundance table (that of Anders & Grevesse 1989), which produces a ~ 15% higher value of the equivalent hydrogen column density and a ~ 10% softer blackbody temperature than those derived with Wilms et al. abundances (cf. note3).
The results of our spectral fits are given in Table 4. We list for each fit (numbered [1–14] as reference for the text) the reduced chi-squared , degrees of freedom and corresponding null-hypothesis probability, the equivalent hydrogen column density NH, model-dependent parameters, and the unabsorbed source flux FX in the 0.1–12 keV energy band. Unless otherwise noted, the errors in the parameters represent the 1σ confidence levels.
We tested several models and found that the emission of J1046 is consistent with previous analysis based on archival data3. However, the much higher quality of our statistics revealed that a single component is hardly satisfactory in describing the source energy distribution. The best-fit single-component model consists of either a blackbody or a non-magnetized neutron star atmosphere. The null-hypothesis probability, which gives the likelihood of having a larger value of by chance, assuming that the model is correct, is low – at best lower than 2% for all single-component models ([1–9] in Table 4). The best-fit power-law model [9] is significantly worse than the thermal models, with a null-hypothesis probability ≪ 1%. The photon index Γ ~ 9 is unreasonably steep and the model is four times more absorbed than the thermal ones. Other models – bremsstrahlung and optically thin thermal plasma (Raymond & Smith 1977) – show even poorer fits. We discuss below the results of the thermal models in more detail.
The best-fit absorbed blackbody [1] has kT∞ = 138(3) eV and 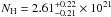 cm-2, with
  for 61 degrees of freedom. The radiation radius, as seen by an observer at infinity, is R∞ ~ (3 − 5)(d/dCar)-1 km, where the distance to J1046 is normalised to that of η Car, dCar = 2.3 kpc (Smith 2006b). In this estimate, we included the flux uncertainty from the abundance tables. Although this radius is smaller than that of a canonical neutron star, it agrees with those measured for the M7: their redshifted radiation radii, as derived from X-ray blackbody fits and distance estimates, are in the range of, roughly, 2 km to 7 km (using the distance estimates and source parameters from e.g. Kaplan 2008; see also Sect. 5.3).
A neutron star atmosphere model (Zavlin et al. 1996; Pavlov et al. 1995, nsa) describes the data statistically nearly as well [4 − 8]. A stellar mass of Mns = 1.4 M⊙ and radius of Rem = 10 km were first assumed [4, 6, 8], then allowed to vary to check for an improved fit [5, 7]. The magnetic field strength was held fixed during fitting, and we tested the values B = 0 G [4–5], B = 1012 G [6–7], and B = 1013 G [8]. The best-fit models typically fit a 60% higher NH than the blackbody and a much softer temperature, kT∞ ~ 30 eV. For the typical absorption in the direction of the Carina Nebula, the implied luminosity distance is implausibly small, d ~ 220 pc. Poorer fits were found when the magnetic field was included and with increasing field intensity. Although the fit was generally not improved when the neutron star mass and radius were allowed to vary, we found a statistically tighter fit for a magnetic field strength of B = 1012 G and with freely varying Mns ~ 2 M⊙ and Rns ~ 7 km (null-hypothesis probability of 1.7%; [7]). In this case, NH and kT∞ were more similar to the most closely fitting blackbody values. However, the stellar mass and radius were largely unconstrained by the model, and the implied source distance is much larger than expected from the measured NH (d ~ 7.5 kpc).
Results of spectral fits.
The best-fit blackbody/neutron star models invariably show residuals around 0.6–0.7 keV and 1.3–1.4 keV (see Fig. 5; left). We note that these features are independent of the choice of source and background regions used to create the spectra (thus exclude improper background subtraction), of the EPIC instrument (they are seen in the data from the three EPIC cameras, but are more pronounced in pn), as well as of the choice of cross-sections and abundance tables available in XSPEC. Before adding yet more complexity to the spectral model, we investigated whether the residuals could be due to a local elemental overabundance in the Carina Nebula.
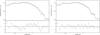 |
Fig. 5 Results of spectral fitting of source J1046. We show the pn data and folded best-fit blackbody model, with residuals. Left. Simple blackbody. Right. Best-fit with oxygen overabundance and a Gaussian absorption line at energy ϵ ~ 1.35 keV. |
Recent studies (e.g. Townsley et al. 2011a, and references therein) have investigated the properties (morphology, emissivity, and elemental abundances) of the hot plasma known to permeate the Carina Nebula. The interaction of the plasma with cold molecular gas is likely responsible for the diffuse soft X-ray emission first detected with the Einstein Observatory (Seward et al. 1979; see Sect. 5.2). Its composition and, in particular, enhanced abundances of key elements indicate whether this soft emission originates in either the wind of the current population of more than 70 massive stars (Smith 2006a) and/or in one or more supernova explosions (Hamaguchi et al. 2007).
We tested the hypothesis of a local elemental overabundance using the variable photoelectric absorption model vphabs convolved with a blackbody in XSPEC. We first attempted to fit the spectra by fixing the elemental abundances at the best-fit values found by Hamaguchi et al. (2007), with freely varying NH and kT [2]. However, the result was considerably worse than that obtained with solar abundances from Wilms et al. Moreover, the residuals remained roughly at the same energies. We then tested for the overabundance of all elements with significant transitions in the range of 0.2 keV to 2 keV (C, N, O, Ne, Mg, ...). We restricted our test to abundance values in the range 1 < Z < 5 in solar units to avoid both subsolar and arbitrarily high metal abundances (see e.g. Townsley et al. 2011a, for a discussion).
Interestingly, we found that, whereas most of the elemental abundances (e.g. C, N, S) remained insensitive to the fit and others (most notably, Mg) were pegged to the hard end of the allowed interval in abundance, the only element that was tightly constrained was oxygen, with ZO = 1.66(12) in solar units [3]. By allowing ZO to be extrasolar, we obtained a much closer agreement between data and model for energies below 1 keV. However, an inspection of the residuals revealed that the feature at energy ~1.3 keV remained in spite of the improved fit and could only be accounted for with a Gaussian line in absorption. We indeed verified that elements with lines around this energy tended to be arbitrarily overabundant in the model.
The inclusion of a Gaussian line in absorption improves the fit considerably [10]. Allowing all parameters to vary freely, we obtained a good fit with  and a much higher null-hypothesis probability. The best-fit model and its residuals can be seen in the right panel of Fig. 5. This model – with NH and kT consistent with the (simple) blackbody values, an oxygen overabundance of ZO = 1.64(15), and a line in absorption at energy
  keV (σ = 0.14 keV and equivalent width of EW = 91 eV) – reproduces the observed spectral energy distribution of J1046 very well. We verified that the results (ϵ,ZO) are insensitive to any changes in NH.
For completeness, we tested other multicomponent models, namely a double blackbody [13], a blackbody with multiple Gaussian absorption lines (with fixed solar abundances, [11–12]), and a blackbody with a power-law tail [14]. The fit results are also listed in Table 4. All parameters in the double blackbody [13] were allowed to vary during fitting. The softer blackbody temperature kT1 was restricted to between 5 eV and 120 eV and the hotter one kT2 to between 0.1 keV and 1 keV. The best fit ( ) gives temperatures of 37 eV and 119 eV. Relative to the single-blackbody fit, the addition of the extra component provides a closer fit to the softer part of the spectrum, eliminating the “excess” detected previously and lowering the value of χ2. However, the two features at energies ~0.6 keV and ~1.3 keV discussed before remain. Given the substantial interstellar medium absorption of the model (NH ~ 5 × 1021 cm-2), the normalisation of the soft component is forcibly very high, two orders of magnitude higher than the hot component. The redshifted emission radius, at a distance of 2.3 kpc, is
  km and
  km. This argues against the physical viability of the model.
To test for the presence of multiple absorption lines, we adopted the following strategy: first, we fitted the data holding the column density fixed at the best single-blackbody value, NH = 2.61 × 1021 cm-2, also keeping the Gaussian σ parameter fixed at a value of 0.1 keV [11]. We then allowed to vary either σ or NH. Finally, we fitted the data allowing all parameters (but the equivalent widths) to vary freely [12]. For all fits, the blackbody temperature was restricted to within 10 eV and 300 eV and the line energy to within 0.1 keV and 2 keV. Spectral fits show good results with two absorption lines invariably at energies around 0.58–0.61 keV and 1.35–1.38 keV. The presence of the lines does not lead to any significant changes in the best-fit values of kT and NH. When NH varies freely, the blackbody is hotter relative to the single-component temperature (kT ~ 140 eV) and the column density is lower, at NH ~ 2.2 × 1021 cm-2 [12].
We note that Hamaguchi et al. (2009) reported evidence of absorption features in the combined spectra of J1046, namely a slight dip around 0.9 keV and a strong one at 0.6 keV. As noted by the authors, the latter is likely to be produced by edge absorption of oxygen in the interstellar medium or in the detector response. We found no evidence in AO9 data to confirm the dip at 0.9 keV, which might have been produced during the combination of both the spectra and calibration files of the three EPIC detectors taken at various off-axis angles and with different instrument configurations.
The blackbody model in combination with a power law [14] was tested to derive the upper limits to the detection of a non-thermal component extending towards higher energies, as usually seen in the emission of middle-aged pulsars dominated by soft thermal components (age ~ few 105 yr, e.g. the “Three Musketeers”); in these objects, power-law tails with Γ = 1.7–2.1 were detected at very low flux levels (0.3–1.7% of the source luminosity; De Luca et al. 2005). To derive upper limits to the detection of a hard non-thermal component, we fitted a power law with photon indices Γ = 1.7 and Γ = 2.1, in addition to the dominant blackbody component. The photon index and a column density of NH = 2.6 × 1021 cm-2 were kept fixed during the fitting. We found that the best-fit blackbody parameters were unaffected by the inclusion of the power-law component. Relative to the single-blackbody model, the fit did not improve and the non-thermal component was found to contribute at most 1–1.1% (3σ confidence level, 0.1–12 keV range) of the unabsorbed flux of the source.
3. ESO-VLT observations
Optical follow-up observations of J1046 with ESO-VLT and SOAR in 2007 and 2008 revealed no counterparts brighter than mR = 25, mB = 26, and mV = 25.5 (2.5σ; Paper I). To derive a deeper limit to the brightness of the optical counterpart, we obtained further ESO-VLT V-band exposures in 2009. The V band is the optimal choice for deep imaging because it excludes some of the strongest lines found in H ii regions (Balmer emission as well as [N ii] and [S ii] emission lines), thus minimizing contamination from bright nebular lines. Additionally, we obtained deep Hα imaging with ESO-VLT in 2010, in order to investigate a possible Balmer-dominated nebula near the position of the X-ray source.
3.1. Observations and data reduction
The VLT 2009 and 2010 observations were obtained under photometric and dark sky conditions for a total ~3.53 h of observing time (see the log of observations in Table 5). The totality of the proposed observing time was executed in two different observing periods (P82 and P85). On both occasions, one of the FOcal Reducer low/dispersion Spectrographs (FORS; Appenzeller et al. 1998) was used.
The FORS detector consists of a mosaic of two 2k × 4k CCDs of pixel size 15 μm. In the 2010 observations (P85), we used FORS2, the camera mounted on UT1, which is optimized for the red band (MIT CCDs), while the 2009 observations of P82 were carried out with FORS1 (E2V CCDs) at UT2. The spectrograph FORS1 is most sensitive to the blue range. The detector provides imaging on a pixel scale of 0.25″ pixel-1 (field-of-view of 6.8′ × 6.8′) using standard-resolution collimator and default readout mode (2 × 2 binning). Dithering patterns with offsets of 5″ were chosen for the observations (with 3 × V and 9 × Hα exposures; see Table 5). The seeing was excellent during the 2009 V observations; unfortunately, it was above the constraint of 0.8″ FWHM during the observing night of April 2010, when most (67%) of our P85 observations were executed.
Description of the optical ESO-VLT observations of J1046.
Data were reduced in two steps. Firstly, we applied IRAF v2.14 (Tody 1986) to process raw frames; secondly, EsoRex 4.3.54 and ESO-VLT recipes were used in order to recreate the instrument pipeline. For both sets of software, standard procedures were adopted and carried out by treating each FORS CCD chip independently. The flat-fielded scientific exposures were combined in order to remove both cosmic rays and bad/hot pixels and increase the S/N of the data. We verified that both (IRAF/EsoRex) reductions yielded very similar results in the analysis, which was also true when compared to the results obtained with the pipeline-reduced scientific frames distributed by ESO-VLT.
3.2. Data analysis
The transformation of the mV instrumental magnitudes to the standard photometric system was done using the zero-point, extinction coefficient and colour term obtained on the night of the observation, as provided by the ESO-VLT calibration webpages5. The Hα images were flux-calibrated using observations of a standard star observed in the same night of the observation (LTT 4816; Hamuy et al. 1994). The astrometric calibration of the stacked science frames was performed using the USNO-B1.0, 2MASS, and GSC2 catalogues and the GAIA 4.2-1 software6. In general, our astrometric errors are of ~ 0.15″ or better. We adopted standard PSF fitting, as implemented in the daophot (Stetson 1987) package for the IRAF environment, to measure magnitudes.
The deep V observation failed to detect the optical counterpart to J1046: as can be seen in the optical image of Fig. 6, no object lies within ~4.3″ ( ≳ 5σ) of the source position. To test the detection limit specifically in the region covered by the error circle of the X-ray source, we added images of synthetic stars of progressively fainter magnitudes to a small section of the combined V image and analysed the combined images using PSF fitting (see Pires et al. 2009a, for details). We defined the limiting magnitude of the 2009 observations as mV = 27.6(5) (2σ), which corresponds to the detected magnitude of the faintest synthetic star successfully measured in the image. Taking the limiting magnitude as an upper limit to the brightness of the optical counterpart of J1046, the implied X-ray-to-optical flux ratio is log (FX/FV) > 3.8, corrected for photoelectric absorption and interstellar extinction. The de-reddened V flux is derived using the X-ray absorption (Sect. 2.4) and the optical extinction, AV ~ 1.51, computed with the Predehl & Schmitt (1995) relation.
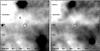 |
Fig. 6 V (left) and Hα (right) images of the field of source J1046. An inverted colour map is used, i.e. brighter objects are darker. The 90% confidence level error circle on the position of the source is of size 0.86″. The images were smoothed using a Gaussian filter of one pixel in size. |
3.3. Searching for a bow-shock or photoionisation nebula
The dense environment of the Carina Nebula and the possibly lowly-ionised local medium surrounding J1046 favour the formation of a bow-shock or of a photoionised nebula that could be detected in the optical. The fraction of neutral hydrogen in the nebula depends on the distance from the sources of ionising radiation, mostly OB stars present in the young stellar clusters Tr 16 (where η Car is) and Tr 14, and on the clumpiness of the local medium. J1046 is located in a region of low diffuse background relative to other parts of the nebula, and is apparently behind an ionisation front from Tr 16 (see Fig. 7). Therefore, most of the local interstellar medium may still be neutral, which favours the detection of an Hα signature around the position of the presumed rapidly-moving neutron star.
A Balmer-dominated nebula was seen around a number of radio pulsars (e.g. Gaensler & Slane 2006) and one (possibly two, see Motch et al. 2005, and the case of RX J1605.3+3249) of the M7, RX J1856.5-3754 (van Kerkwijk & Kulkarni 2001). Two possible scenarios are invoked to explain the presence of such a nebula: bow-shocks (e.g. Chatterjee & Cordes 2002) and photoionisation by X-rays (Blaes et al. 1995). The shape and emissivity of the nebula can provide invaluable information about the INS velocity, direction of motion, and rotational energy losses, allowing one to constrain its age and evolutionary state.
Motivated by the above, we estimated the expected Hα flux from J1046 for both scenarios, considering angular (projected) separations of the apex of the nebula relatively to the neutron star position (stand-off radius R0) in the range from 0.5″ to 5″. Simulations using the photoionisation code XSTAR7 predicted an Hα flux (taking into account the interstellar extinction) of fHα ~ 10-17 − 10-16 erg s-1 cm-2 arcsec-2, for a local density of 50 cm-3 (e.g. Paper I) assuming the spectral properties of J1046 (Sect. 2.4). The resulting flux range is consistent with the expectations of Blaes et al. (1995) for a similar neutron star luminosity and medium density, and with that measured for the M7 RX J1856.5-3754.
Alternatively, in the bow-shock scenario, a neutron star of velocity vns = 10−100 km s-1 moving through a uniform medium of density n = 50 cm-3, where (conservatively) half of the hydrogen atoms is still neutral, requires a spin-down luminosity of Ė > 1034 erg s-1 to create bow-shocks with stand-off radii in the range R0 = 0.5″ − 5″ (see the formulation of e.g. Cordes et al. 1993). These shocks correspond to an Hα flux of fHα ~ 10-15−10-14 erg s-1 cm-2 arcsec-2, accounting for absorption. If, conversely, the spin-down luminosity of J1046 is lower, more typical of those of the M7 (Ė ~ 1031 erg s-1), the Hα nebula is then expected to be less bright, fHα ~ 4 × 10-17 erg s-1 cm-2 arcsec-2, and (at d = 2.3 kpc) nearly angularly coincident with the position of the neutron star. In any case, these figures indicate that the flux in the Balmer line may be high enough to allow detection with ~3 h of VLT observations, for both (photoionisation/bow-shock) scenarios.
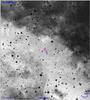 |
Fig. 7 ESO-MAMA wide-field R band image of the area around J1046 (marked by a cross), in the direction of the Carina Nebula. The young OB associations Tr 16 and Tr 14, as well as η Car, are located NW of the source, towards the bright diffuse emission. |
Previous Hα imaging of the field of the X-ray source, obtained with SOAR in 2008, was badly affected by fringing (Paper I). Our new VLT observations do reveal some extended structure in the vicinity (within 1″) of the position of the X-ray source (Fig. 6; right). The Hα flux is fHα ~ 3.6 × 10⁻¹⁵ erg s-1 cm-2 arcsec-2 – at least one order of magnitude brighter than that expected if the nebular emission was created by X-ray photoionisation as previously discussed, but still formally consistent with the expectations of the bow-shock scenario for Ė > 1034 erg s-1 (typical of young rotation-powered pulsars). However, given the presence of similar diffuse emission in other parts of the nebula, it is unlikely that the observed structure is indeed related to the neutron star.
4. Gamma-ray analysis
Our measurement of the neutron star spin period permits us to search for pulsed emission also in γ-rays, using data from the AGILE and Fermi-LAT missions. This is particularly interesting given the large time spans of data that can be used to constrain the period derivative of the pulsar. Although no plausible γ-ray counterpart is present within >5σ of the position of the X-ray source in either the AGILE Bright Source Catalogue (Pittori et al. 2009) or the Second Fermi-LAT Catalogue (2FGL; The Fermi-LAT Collaboration 2012), a search for a periodic signal can be more sensitive than spatial detections (see Zane et al. 2011, and references therein, for a discussion).
Data reduction was performed by making use of the software specific to each telescope and the whole available data span of both satellites. Public data from the AGILE mission were accessed via the Agenzia Spazionale Italiana Science Data Center (ASDC) Multi-Mission Interactive Archive8. The analysis covers the time span from 2007 July 13 (MJD 54 294) to 2011 April 5 (MJD 55 656), which amounts to 169,289 photons extracted around 5° (in order to match the point spread function of the instruments at energies E > 100 MeV) from the position of J1046, as reported in Table 2. We applied the AGILE pulsar pipeline to perform data selection and barycentering. For details of the AGILE observing strategy, timing calibration, and γ-ray pulsar analysis, we refer the reader to Pellizzoni et al. (2009a,b).
The public archive of the Fermi Science Support Center9 was accessed to retrieve Fermi-LAT data. Again defining a region-of-interest of 5° around the position of the source, 760,327 photons with energy higher than 100 MeV and registered between 2008 August 5 (MJD 54 683) and 2011 March 30 (MJD 55 650) were extracted in the timing analysis, using the Fermi-LAT Science Tool10 gtselect. Good-time intervals and data filters recommended by the Fermi-LAT Team were also applied with gtmktime. Finally, the photons were barycentred using the gtbary tool.
We searched for periodicities using as a starting point the spin period of the source observed in X-rays (Sect. 2.3). The two data sets (AGILE/Fermi-LAT) were used separately and simultaneously. A pulsed signature was searched in frequency domain close to the nominal frequency ν ∗ = 53.645804 Hz and around it, using a frequency step of the order 1/Ts (where Ts is the time span of the analysed data set). To look for significant pulsations, we applied a Pearson χ2 test to the ten-bin pulsed profile resulting from each search trial. We also applied a (bin-independent)  test (Buccheri et al. 1983) to each analysed data set.
It is worth noting that the restricted information available for J1046 greatly enhances the search in terms of parameter space. The number of trials, given the long Ts for both the AGILE and Fermi-LAT data sets, significantly increases, even when searching only around 1σ in frequency from the nominal value. As a first approach, the first and second period derivatives were set to zero and not allowed to vary. A wider search was then performed across a small range of period derivatives. Furthermore, to extend the search to a broader frequency range (around 10σ of ν ∗ ), the time span of the analysis was restricted to cover only the photons registered in December 2010, when the X-ray observations took place.
No significant periodicity (>4σ) was found. Although tentative pulsations result from individual searches, overall inconsistencies prevent a secure detection from being claimed in γ-rays. Hence, we set a 4σ upper limit of Fγ < 4 × 10⁻⁸ ph s-1 cm-2 at energies above 100 MeV, for a pulsed γ-ray signal from J1046.
5. Discussion
We first summarize our results and then discuss the origin of J1046 in relation to the former generation of massive stars in the Carina Nebula and its possible evolutionary state. We interpret our findings in the light of the observed properties of the currently known neutron star population and compare J1046 to other peculiar objects. The intriguing possibility of detecting J1046 with the current and future generation of gravitational wave detectors is briefly discussed. Finally, we consider the possible number of Galactic neutron stars and the prospects of finding new thermally emitting sources with the eROSITA mission (Predehl et al. 2010), planned to be launched in 2013.
5.1. Summary of results
We have presented the results of the first dedicated observational campaign designed to investigate the properties of the isolated neutron star 2XMM J104608.7-594306. Our analysis is based on new observations obtained with the XMM-Newton Observatory and the ESO Very Large Telescope, as well as publicly available γ-ray data from the Fermi Space Telescope and the AGILE Mission. Our observational campaign has confirmed expectations based on a previous analysis of archival data and revealed a unique and peculiar object.
The new XMM-Newton observation alone collected a factor of two more source counts than all previous X-ray observations (that serendipitously detected the neutron star in the past 12 years) did collectively. The higher quality statistics and higher time resolution of the pn camera in small window mode, has permitted the measurement of the period of the very likely neutron star spin, at an unexpectedly rapid rotation of P ~ 18.6 ms. The detection of the periodicity, corresponding to a pulsed fraction of pf ~ 14%, has a chance of 1 in 16 000 of being spurious. No other periodicity is significantly detected (>1σ) across a very broad period range, P = 0.0114–10 000 s in pn data. The analysis of the three EPIC cameras together more tightly constrained the periodicities with pf > 10% (3σ) and P > 0.6 s (0.3–2.5 keV), thus considerably improving previous limits in this frequency range.
The XMM-Newton observation also confirmed the purely thermal nature of the source. The energy distribution is most accurately described by a simple blackbody of temperature kT∞ ~ 135 eV, with significant deviations (absorption features) around energies 0.6 keV and 1.35 keV. While the first feature is more likely related to a local oxygen overabundance in the Carina Nebula or along the line-of-sight, the second one can only be accounted for by an additional spectral component, modelled as a Gaussian line in absorption. The source emission is very soft with practically no counts above 2 keV; in contrast to standard rotation-powered pulsars and magnetars, a non-thermal component extending towards higher X-ray energies is detected insignificantly (<3σ) at flux levels higher than 1% of the source luminosity ( erg s-1, 0.1–12 keV). Similarly, we found no evidence of a two-temperature spectral model, as is often the case for thermally emitting radio-quiet neutron stars located near the centre of supernova remnants (CCOs; see de Luca 2008, for a review), some transient AXPs, or Calvera (Sect. 5.3).
The new ESO-VLT observations set an even deeper limit (relative to previous optical follow-up) to the brightness of the optical counterpart of J1046, mV > 27 (2σ); the optical flux is therefore at least 6300 times fainter than the X-ray emission of the neutron star, confirming the compact nature of the source. Although a diffuse Hα excess is present near the position of the X-ray source, similar background emission in other parts of the nebula indicates that it is unlikely to be related to the neutron star.
Our analysis of public γ-ray data has revealed no significant detection. Given the still unknown and unconstrained period derivative of the pulsar (see our discussion below), it is difficult to say whether any should be expected. By analogy with other INSs, it is likely that the pulsar spin-down luminosity is too small, given its estimated distance, to observe γ-ray emission with the present sensitivity.
5.2. Former generation of massive stars in the Carina Nebula
The Great Nebula in Carina is an ensemble of young and rich stellar clusters, highly structured dust clouds and pillars, cavities, and bubbles created by the dramatic interaction of ionisation fronts with scattered molecular material (see Smith & Brooks 2008; Townsley et al. 2011b, for reviews). Star formation is currently underway, as revealed by the presence of e.g. pre-main-sequence objects, microjets as well as many candidate young stars detected in the infrared (Smith et al. 2010a,b). Moreover, populations of stars with ages of from 5 to 10 Myr, as in Tr 15 (Wang et al. 2011), support evidence that star formation has been ongoing for the past several million years – i.e., a sufficiently long time for the most massive objects belonging to the former stellar generation in the complex to have already ended their lives in core-collapse events.
Although for instance Smith (2006a) and Smith & Brooks (2008) argue that past supernovae are not needed on energetic grounds alone to create the observed cavities and superbubbles, there is growing evidence that at least one explosion has occurred in Carina: (i) the detection of an unusual and broad emission feature at 22 μm, related with recently synthesized dust, which has only been observed in the Cassiopeia A supernova remnant and in starburst galaxies (Chan & Onaka 2000); (ii) enhanced abundances of iron and silicon in the southern part of the nebula relative to other regions, which indicate that the metal enrichment originated in a supernova rather than winds of evolved stars (Hamaguchi et al. 2007; Ezoe et al. 2009); (iii) the presence of high-velocity expanding structures, which are predominantly located in front of main sources of ionisation, such as the stellar cluster Tr 16 (Walborn et al. 2007); (iv) the evidence of charge exchange as the origin of Carina’s diffuse soft X-ray emission, since a rarefied hot plasma resulting from an old supernova is a necessary condition for generating such a process (Townsley et al. 2011a).
The discovery of J1046 provides further support for the past supernova hypothesis (Hamaguchi et al. 2009; Townsley et al. 2011a). The column density derived from the X-ray spectral fits is indeed consistent with the source being located in the Nebula; its softness excludes an extragalactic object, given the Galactic absorption along the line-of-sight (NH = 1.35 × 1022 cm-2; Dickey & Lockman 1990). Townsley et al. (2011a) suggested that J1046 might have been the first discovered neutron star and that others are still hidden in the Nebula, proposing an additional six X-ray sources without any evident optical or infrared counterparts as possible INS candidates (see their Table 2). In practice, however, the faintness of these candidates (observed fluxes of fX ~ 10-15 − 10-16 erg s-1 cm-2 in the 0.5–8 keV energy band; Broos et al. 2011) requires unrealistically deep follow-up optical observations in order to confirm their tentative compact nature: observed upper limits in range mB = 29–30 are needed to reach an X-ray-to-optical flux ratio of 100, which is still not high enough to discard either cataclysmic variables or background active galactic nuclei.
If J1046 is indeed a remnant of a former population of massive stars in Carina, the source is still somewhat young; younger than several 106 yr, considering typical main-sequence phases of 0.5 − 5 Myr.
5.3. Possible nature and relation to other neutron stars
The new results of our observing campaign targeting J1046 can be used to understand how peculiar groups of isolated neutron stars relate to each other, as well as to the bulk of the normal radio pulsar population. We therefore compare the spectral and timing properties of possible “missing links” – J1046, RRAT J1819-1458, and Calvera – with those of other thermally emitting INSs, namely the M7, magnetars, CCOs, and millisecond pulsars (MSPs). We first briefly review the properties of CCOs and MSPs in the next subsection (for magnetars, the M7, Calvera and RRATs, we refer to Sect. 1, and references therein). In the discussion, we assume that the pulsar spin down is due to magnetic dipole braking, i.e. dipolar magnetic field Bdip = 3.2 × 10¹⁹(PṖ)1/2 G, spin-down luminosity Ė = 4.5 × 1046(ṖP-3) erg s-1, and τch = P/(2Ṗ) s, where τch is the pulsar characteristic time.
5.3.1. Properties of thermally emitting INSs
Millisecond pulsars are old and low-magnetized (τch = 0.1 − 10 Gyr and Bdip ≲ 1010 G) neutron stars, mostly observed in both binary systems and globular clusters. Accretion in a binary system is thought to be responsible for “recycling” these old neutron stars, first by spinning up the pulsar to millisecond periods so radio emission is turned on again, second by heating areas of the surface – polar caps or hot spots – which can then emit X-rays. The bulk of the X-ray radiation is usually thermal and originates from the hot spots. Power-law tails, or purely non-thermal X-ray emission, are also often observed in these objects. Interestingly, Fermi-LAT has also revealed that MSPs are a major contributor to the Galactic γ-ray source population, providing insights into the magnetospheric emission processes (e.g. Abdo et al. 2009, 2010).
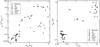 |
Fig. 8 Blackbody luminosity vs. emission radius (left) and emission radius vs. neutron star spin period (right) for several populations of thermally emitting INSs (see text). |
Of the seven confirmed CCOs, at least three fit the “anti-magnetar” scenario (Halpern & Gotthelf 2010; Gotthelf & Halpern 2010), in which these objects are young (ages 103 − 104 yr), low-magnetized (B ≲ few 1011 G) neutron stars, born rotating at a period similar to its present value (of hundreds of milliseconds). Spin-down values and upper limits are very low, confining anti-magnetars to a “transition” region of the P − Ṗ diagram, in-between those occupied by normal rotation-powered pulsars and MSPs. The energy distribution of CCOs is generally described by a double blackbody model, where the emission radii (as seen by a distant observer) are typically smaller than a few km. The double blackbody, unusual pulse profiles, and strongly pulsed fractions have been interpreted in the framework of a model, where a pair of thermal, antipodal hot spots of different sizes and temperatures are present at the neutron star surface (see Gotthelf et al. 2010, and the case of the CCO RX J0822-4300 in the supernova remnant Puppis A). This temperature anisotropy can be understood as the result of a large difference in intensity between crustal and dipolar components of the magnetic field of the neutron star (Turolla et al. 2011; Shabaltas & Lai 2012). As a CCO ages, its host supernova remnant is expected to dissipate, whereas the pulsar does not undergo considerable spin down. If standard cooling is at work (e.g. Page 1998), the neutron star can still be observed as a thermal source for the subsequent several Myrs. However, intriguing observational evidence suggests that the CCO CXOU J232327.9+584842 in the supernova remnant Cassiopeia A might have experienced enhanced cooling in the past 10 yr (Heinke & Ho 2010), which has been interpreted as evidence of the onset of neutron superfluidity in the core of this young neutron star (Page et al. 2011; Shternin et al. 2011; alternative interpretations exist, e.g. Blaschke et al. 2012). That no “orphan” CCO (i.e. without a supernova remnant) is recognized among the X-ray emitting INSs observed in the solar vicinity, whereas they are expected to represent about one-third of the neutron star population (Halpern & Gotthelf 2010), might indeed suggest that CCOs cool down faster than expected, also perhaps due to accreted light-element envelopes once the neutron star is in the photon-cooling stage (age ≳ 105 yr; Yakovlev & Pethick 2004).
5.3.2. Relations to peculiar objects and INS populations
In the following discussion, we consider the thermal X-ray luminosities (LX), emission radii (Rbb), and blackbody temperatures (kT) reported in Durant & van Kerkwijk (2006), Mereghetti (2008), Ng et al. (2011, for AXPs), Kaplan (2008, for the M7), Halpern & Gotthelf (2010, and references therein; for CCOs), Bogdanov et al. (2006, 2011, for the X-ray, Zane et al. (2011, for Calvera), and McLaughlin et al. (2007, for RRAT J1819-1458. We note that the distance to Calvera is not well-constrained; its spectral properties are hence normalised to a distance of 1 kpc. For J1046, we use the corresponding values of LX = 5 × 1032 erg s-1, Rbb = 4 km and kT = 135 eV for a neutron star located at d = 2.3 kpc (Sect. 2.4). Other pulsar properties are taken from the ATNF Pulsar Catalogue (Manchester et al. 2005)11.
In Fig. 8, we compare both the X-ray luminosities of these neutron stars as a function of emission radius and the emission radius as a function of rotation period. The plots show that the four main groups – magnetars, CCOs, the M7, and MSPs – occupy distinct regions of these diagrams. The LX − Rbb diagram (Fig. 8; left) shows that the spectral properties of J1046 are remarkably similar to those of the M7. This resemblance is strenghtened by the presence of a broad line in absorption in the spectrum of the source (Sect. 5.3.3). On the other hand, the diagram on the right in Fig. 8 shows a completely different picture: the detection of J1046’s very rapid rotation is puzzling and at odds with its purely thermal, M7-like, spectrum. While all M7 and the RRAT have spin periods of a few seconds, which are in the same range as those observed in magnetars, J1046 is found to be isolated in a region devoid of any other thermally emitting INS.
In general, similar rapidly spinning neutron stars are expected to be either young and energetic rotation-powered pulsars (with Bdip ~ 1012 G, Ė ≳ 1036 erg s-1, and τch ~ 103 − 104 yr) or, conversely, old recycled neutron stars with low magnetic fields and spin-down luminosities, and old characteristic ages. In the absence of any constraint on J1046’s spin down, a rotation-powered pulsar is a viable, although unlikely, scenario. The absence of a supernova remnant or a pulsar wind nebula is indicative of an age older than a few 104 yr and a dipolar magnetic field weaker than Bdip ~ 7 × 10¹¹ G. However, the unusually soft and thermal energy distribution of the source, its lack of magnetospheric activity, and emission at γ-rays are in contrast to other rotation-powered pulsars of similar timing properties.
The likely presence of J1046 in a star-forming region (Sect. 5.2) supports the idea that the neutron star is not old, i.e. it was most probably not (fully) recycled in a binary system with a low-mass companion that was either evaporated or completely accreted (which only happens on timescales of 108 yr). If the rapid rotation of the source were the result of spin up in a binary system, then its companion should have been another massive star. In these systems, a shorter period (106 − 107 yr) of mass transfer takes place until the second supernova event disrupts the system. J1046 would then be the first, “mildly-recycled” pulsar ejected from the system, with a spin period and a magnetic field in-between those of normal rotation-powered pulsars and old MSPs (see e.g. Lorimer et al. 2004; Belczynski et al. 2010). Its former companion, which is expected to be a young pulsar, could thus still be hidden in the Carina Nebula. We note however that the luminosity and spectral properties of J1046 are still atypical relative to those of recycled objects, as illustrated by the diagrams in Fig. 8.
Another intriguing possibility is that of an old CCO, as discussed in the case of Calvera (Rutledge et al. 2008; Zane et al. 2011). In terms of its spectral properties, Calvera somewhat differs from J1046, in that it shows clear evidence of a two-temperature thermal model and a non-thermal component extending towards higher energies cannot be excluded below ~ 10% of the source luminosity. As discussed by Zane et al., the thermal components possibly originate in two different small spots on the stellar surface, a scenario that is consistent with Calvera’s measurement of a relatively large pulsed fraction. These spectral characteristics are those expected from an older (i.e. colder and less luminous) and orphan CCO, as also suggested by the absence of a supernova remnant12. Calvera, for a distance of d = 1 kpc, indeed clusters together with the three CCOs with known periods in the Rbb − P diagram of Fig. 8. Keeping in mind the low statistics and given the still poorly known overall characteristics of the population of Galactic anti-magnetars, the possibility of an old CCO remains open for J1046, although we note that the overall spectral properties of the source do not match those expected for this scenario (e.g. double thermal component, size of emission radius, and pulsed fraction).
To more clearly understand the nature of this INS, further X-ray observations would be extremely helpful, particularly given our ability to constrain the neutron star spin-down rate. For this matter, we have been granted new XMM-Newton observations for the next period of observation (AO11). With a second epoch, we can constrain spin-down rates of higher than Ṗ ≳ 2.5 × 10⁻¹⁶ s s-1 and magnetic fields of Bdip ≳ 6 × 10¹⁰ G (2σ), assuming standard magnetic dipole braking. The corresponding lower limit to Bdip is ≳ 3.4σ below the mean field strength of normal radio pulsars (Faucher-Giguère & Kaspi 2006) and provides sufficient evidence to associate J1046 with either peculiar, low-magnetized objects, such as an old CCO and a mildly-recycled pulsar, or the normal rotation-powered population.
5.3.3. Spectral line in absorption
New XMM-Newton data on J1046 may also provide additional evidence of the spectral line at ϵ = 1.35 keV (Sect. 2.4). Similar spectral features in absorption (in a couple of cases, also harmonically spaced) are seen in the spectra of several thermally emitting INSs: the CCO 1E 1207.4-5209 (Sanwal et al. 2002; Mori et al. 2005); the rotating radio transient RRAT J1819-1458 (McLaughlin et al. 2007); six of the M7 (Haberl 2007); possibly13 Calvera (Zane et al. 2011) and now J1046; these have typically been modelled by broad Gaussian absorption lines added to a simple blackbody continuum (see, however, the case of RX J1308.6+2127; Hambaryan et al. 2011). In the case of the M7, the broad features have complex and phase-dependent shapes and the line depths often exceed 50%. The presence of narrow absorption features, possibly related to either interstellar or circumstellar highly ionised oxygen, was also reported in the co-added RGS spectra of three of the M7 (Hambaryan et al. 2009; Hohle et al. 2012).
The spectral absorption features are generally understood in terms of the neutron star magnetic field, although its interpretation is not unique. They can be related to cyclotron transitions of either protons (Bcyc ~ 1013 − 1014 G) or electrons (Bcyc ~ 1010 − 1011 G); an alternative explanation would rest upon atomic transitions in the outermost layers of the neutron star (Lai 2001).
If the line at energy ϵ = 1.35 keV detected in the spectrum of J1046 is interpreted as electron cyclotron absorption similar to the case of the CCO 1E 1207.4-5209, then the magnetic field of the source is expected to be of the order of Bcyc = 1.5 × 10¹¹ G. This estimate is based on the assumption that the line is the fundamental and that the gravitational redshift of the neutron star is zg = 0.3, according to the relation Ecyc = 1.16(B/1011 G)(1 + zg)-1. Alternatively, the feature could be the only first harmonic of a fundamental at an energy ϵ ~ 0.65−0.7 keV, whose detection is unfortunately affected by our interpretation of a local oxygen overabundance in the Carina Nebula. In this case, the magnetic field would be lower, B = 7 × 10¹⁰ G. These estimates can be confronted with the upper limits derived from the pulsar spin down.
5.4. Future prospects
The knowledge of the pulsar spin down (and its associated quantities Bdip, τch, Ė) is crucial to help us characterise the source J1046. Furthermore, a constraint on the period derivative significantly narrows the parameter space of searches for a pulsed γ-ray signal or even for gravitational waves from the neutron star.
Gravitational wave observatories have the potential to probe several aspects of neutron star physics, in particular providing constraints on the state of matter at extreme densities (see e.g. Andersson et al. 2011, for a review). Although a detection has not yet been reported, the observatories have provided a wealth of interesting information on the Galactic neutron star population (e.g. Abbott et al. 2008, 2010; Abadie et al. 2010a,b, 2012b, 2011, 2012a; Accadia et al. 2010). The second generation of gravitational wave detectors (e.g. Advanced LIGO) might allow the first detection (Andersson et al. 2011).
Rapidly-spinning and young neutron stars in our Galaxy are the best targets to search for a continuous gravitational wave signal with ground-based interferometric observatories. The rapid rotation of J1046 implies that it emits continuous gravitational waves at a frequency f ~ 110 Hz, where LIGO’s S/N is the highest (see Abbott et al. 2010, their Fig. 4). In principle, a spin-down rate as low as Ṗ ~ 8 × 10-16 s s-1, which may be detected with the new XMM-Newton observation planned in AO11, places J1046 within the sensitivity of the LIGO’s S5 Scientific Run, considering the whole data set of integration. This estimate, of course, simplistically assumes a 100% conversion of spin-down energy into gravitational waves, regardless of how large a neutron star asymmetry is required to power such emission. In any case, its rapid rotation, quite young age, and relative proximity make this neutron star in the Carina Nebula an interesting prospect for gravitational wave detection with Advanced LIGO (Owen, priv. comm.).
In spite of many searches and interesting case studies, no other thermally emitting INS, presenting exactly the same characteristics as the M7, has been identified outside the solar vicinity to date (see also the case of the high-B radio pulsar PSR J0726-2612, which is another likely product of the Gould Belt; Speagle et al. 2011). It is therefore very important for population studies to understand why there are so many thermally emitting sources with similar periods (and presumably ages and magnetic fields) in such a small volume. Is this an anomaly caused by the Sun’s current location close to regions of active stellar formation of the Gould Belt or does it really mean that radio surveys do miss a large population of INSs, at least as large as that of normal radio pulsars? To answer these questions, investigations at fainter fluxes as well as population modelling in the Galactic scale are needed.
eROSITA (Extended Röntgen Survey with an Imaging Telescope Array14) will extend the ROSAT All-Sky Survey (Voges et al. 1999) towards higher energies, with unprecedented spectral and angular resolution. The effective area of eROSITA is twice that of one XMM-Newton telescope at energies below 2 keV and its sensitivity during the planned all-sky survey will be approximately 30 times that of ROSAT. These properties combined will allow an estimated number of from about 100 to 200 new X-ray thermally emitting INSs to be discovered, after four years of the eROSITA survey. The above figures are derived using the population synthesis model described in Pires (2009)15. Expectations for the same population based on the model of Popov, Boldin, and collaborators predict a more modest number, of ~30 new discoveries after the planned years of survey. Although many of the assumptions considered in our population synthesis model differ from those of Popov et al., preventing a proper comparison, we estimate that the likely parameters controlling the discrepancy are the adopted cooling rates and, to a lower extent, the model of the interstellar medium distribution.
6. Conclusions
Our observational campaign on 2XMM J104608.7-594306 has confirmed previous expectations and revealed a unique object. Most notably, our deep XMM-Newton observation has allowed us to unveil the rotation of the neutron star: a very fast spin period of 19 ms is surprisingly at odds with J1046’s purely thermal energy distribution, which is reminiscent of those of the Magnificent Seven. Spectral features in absorption have also been positively identified. The nature of the source remains open to different possible interpretations, a relation to the still poorly known class of Galactic anti-magnetars being a favoured scenario. New XMM-Newton data, granted for the next cycle of observations (AO11), will greatly improve the current observational picture of this source, and enable us to tightly constrain the pulsar spin down. Dedicated radio observations would be similarly invaluable to help us unveil any truely radio-quiet nature.
Of the more than 60 RRATs known to date, ~20 have precise position determinations and six have been investigated in X-rays; see Keane et al. (2011) and Keane & McLaughlin (2011) for reviews.
In spite of the ten-year-long timebase, a proper motion study in X-rays is impractical due to the source’s estimated distance (d ~ 2 kpc) and to the large off-axis angles and corresponding positional errors in the observations before AO9.
The best-fit blackbody model gives kT∞ = 122(4) eV and  cm-2, with the abundance table of Anders & Grevesse (1989).
Available at http://fermi.gsfc.nasa.gov/ssc/data/analysis/software
As pointed out by Halpern (2011) and in spite of its spectral properties, the upper limit to Calvera’s spin down, derived from X-ray timing alone, does not exclude a normal rotation-powered pulsar.
As noted by Zane et al., the contributions of the two thermal components in the spectra of Calvera intersect near 0.65 keV, which is probably why the spectral fit can be accommodated by introducing an additional feature – either a Gaussian line or an edge – around this energy.
Available at http://scd-theses.u-strasbg.fr/1876
Acknowledgments
The authors would like to express their thanks to R. Rutledge and B. Owen for fruitful discussions and suggestions. We also thank the XMM-Newton Helpdesk, in particular M. Ehle and R. Gonzalez-Riestra, for extensive discussions during the preparation of the phase II of the AO9/AO11 observations. The work of A.M.P. is supported by the Deutsche Forschungsgemeinschaft (grant PI 983/1-1). A.M.P. gratefully acknowledges support from the Alexander von Humboldt Foundation (Fellowship for Postdoctoral Researchers) and FAPESP, Brazil (grant 2009_18499-6).
References
- Abadie, J., Abbott, B. P., Abbott, R., et al. 2010a, Phys. Rev. D, 82, 102001 [NASA ADS] [CrossRef] [Google Scholar]
- Abadie, J., Abbott, B. P., Abbott, R., et al. 2010b, ApJ, 722, 1504 [Google Scholar]
- Abadie, J., Abbott, B. P., Abbott, R., et al. 2011, Phys. Rev. Lett., 107, A261102 [NASA ADS] [CrossRef] [Google Scholar]
- Abadie, J., Abbott, B. P., Abbott, R., et al. 2012a, Phys. Rev. D, 85, 022001 [NASA ADS] [CrossRef] [Google Scholar]
- Abadie, J., Abbott, B. P., Abbott, R., et al. 2012b, Phys. Rev. D, 85, Issue 12, id. 122001 [Google Scholar]
- Abbott, B., Abbott, R., Adhikari, R., et al. 2008, ApJ, 683, L45 [Google Scholar]
- Abbott, B. P., Abbott, R., Acernese, F., et al. 2010, ApJ, 713, 671 [Google Scholar]
- Abdo, A. A., Ackermann, M., Ajello, M., et al. 2009, Science, 325, 845 [NASA ADS] [CrossRef] [Google Scholar]
- Abdo, A. A., Ackermann, M., Ajello, M., et al. 2010, A&A, 524, A75 [NASA ADS] [CrossRef] [EDP Sciences] [Google Scholar]
- Accadia, T., Swinkels, B. L., & the VIRGO Collaboration 2010, Class. Quant. Grav., 27, 084002 [NASA ADS] [CrossRef] [Google Scholar]
- Agüeros, M. A., Anderson, S. F., Margon, B., et al. 2006, AJ, 131, 1740 [NASA ADS] [CrossRef] [Google Scholar]
- Agüeros, M. A., Posselt, B., Anderson, S. F., et al. 2011, AJ, 141, 176 [NASA ADS] [CrossRef] [Google Scholar]
- Aguilera, D. N., Pons, J. A., & Miralles, J. A. 2008, ApJ, 673, L167 [NASA ADS] [CrossRef] [Google Scholar]
- Anders, E., & Grevesse, N. 1989, Geochim. Cosmochim. Acta, 53, 197 [Google Scholar]
- Andersson, N., Ferrari, V., Jones, D. I., et al. 2011, Gen. Rel. Grav., 43, 409 [Google Scholar]
- Appenzeller, I., Fricke, K., Fürtig, W., et al. 1998, The Messenger, 94, 1 [NASA ADS] [Google Scholar]
- Atwood, W. B., Abdo, A. A., Ackermann, M., et al. 2009, ApJ, 697, 1071 [NASA ADS] [CrossRef] [Google Scholar]
- Belczynski, K., Lorimer, D. R., Ridley, J. P., & Curran, S. J. 2010, MNRAS, 407, 1245 [NASA ADS] [CrossRef] [Google Scholar]
- Blaes, O., Warren, O., & Madau, P. 1995, ApJ, 454, 370 [NASA ADS] [CrossRef] [Google Scholar]
- Blaschke, D., Grigorian, H., Voskresensky, D. N., & Weber, F. 2012, Phys. Rev. C, 85, 022802 [NASA ADS] [CrossRef] [Google Scholar]
- Bogdanov, S., Grindlay, J. E., Heinke, C. O., et al. 2006, ApJ, 646, 1104 [NASA ADS] [CrossRef] [Google Scholar]
- Bogdanov, S., van den Berg, M., Servillat, M., et al. 2011, ApJ, 730, 81 [Google Scholar]
- Broos, P. S., Townsley, L. K., Feigelson, E. D., et al. 2011, ApJS, 194, 2 [NASA ADS] [CrossRef] [Google Scholar]
- Buccheri, R., Bennett, K., Bignami, G. F., et al. 1983, A&A, 128, 245 [NASA ADS] [Google Scholar]
- Chan, K.-W., & Onaka, T. 2000, ApJ, 533, L33 [NASA ADS] [CrossRef] [Google Scholar]
- Chatterjee, S., & Cordes, J. M. 2002, ApJ, 575, 407 [NASA ADS] [CrossRef] [Google Scholar]
- Chieregato, M., Campana, S., Treves, A., et al. 2005, A&A, 444, 69 [NASA ADS] [CrossRef] [EDP Sciences] [Google Scholar]
- Cordes, J. M., Romani, R. W., & Lundgren, S. C. 1993, Nature, 362, 133 [NASA ADS] [CrossRef] [Google Scholar]
- de Luca, A. 2008, in 40 Years of Pulsars: Millisecond Pulsars, Magnetars and More, eds. C. Bassa, Z. Wang, A. Cumming, & V. M. Kaspi, AIP Conf. Ser., 983, 311 [Google Scholar]
- De Luca, A., Caraveo, P. A., Mereghetti, S., Negroni, M., & Bignami, G. F. 2005, ApJ, 623, 1051 [NASA ADS] [CrossRef] [Google Scholar]
- Dickey, J. M., & Lockman, F. J. 1990, ARA&A, 28, 215 [NASA ADS] [CrossRef] [MathSciNet] [Google Scholar]
- Durant, M., & van Kerkwijk, M. H. 2006, ApJ, 650, 1070 [NASA ADS] [CrossRef] [Google Scholar]
- Ezoe, Y., Hamaguchi, K., Gruendl, R. A., et al. 2009, PASJ, 61, 123 [NASA ADS] [Google Scholar]
- Faucher-Giguère, C.-A., & Kaspi, V. M. 2006, ApJ, 643, 332 [NASA ADS] [CrossRef] [Google Scholar]
- Gaensler, B. M., & Slane, P. O. 2006, ARA&A, 44, 17 [NASA ADS] [CrossRef] [Google Scholar]
- Gotthelf, E. V., & Halpern, J. P. 2010, in BAAS, 42, AAS/High Energy Astrophysics Division, 11, 694 [Google Scholar]
- Gotthelf, E. V., Perna, R., & Halpern, J. P. 2010, ApJ, 724, 1316 [NASA ADS] [CrossRef] [Google Scholar]
- Haberl, F. 2007, Ap&SS, 308, 181 [NASA ADS] [CrossRef] [Google Scholar]
- Halpern, J. P. 2011, ApJ, 736, L3 [NASA ADS] [CrossRef] [Google Scholar]
- Halpern, J. P., & Gotthelf, E. V. 2010, ApJ, 709, 436 [NASA ADS] [CrossRef] [Google Scholar]
- Hamaguchi, K., Petre, R., Matsumoto, H., et al. 2007, PASJ, 59, 151 [NASA ADS] [Google Scholar]
- Hamaguchi, K., Corcoran, M. F., Ezoe, Y., et al. 2009, ApJ, 695, L4 [NASA ADS] [CrossRef] [Google Scholar]
- Hambaryan, V., Neuhäuser, R., Haberl, F., Hohle, M. M., & Schwope, A. D. 2009, A&A, 497, L9 [NASA ADS] [CrossRef] [EDP Sciences] [Google Scholar]
- Hambaryan, V., Suleimanov, V., Schwope, A. D., et al. 2011, A&A, 534, A74 [NASA ADS] [CrossRef] [EDP Sciences] [Google Scholar]
- Hamuy, M., Suntzeff, N. B., Heathcote, S. R., et al. 1994, PASP, 106, 566 [NASA ADS] [CrossRef] [Google Scholar]
- Heinke, C. O., & Ho, W. C. G. 2010, ApJ, 719, L167 [NASA ADS] [CrossRef] [Google Scholar]
- Heyl, J. S., & Kulkarni, S. R. 1998, ApJ, 506, L61 [NASA ADS] [CrossRef] [Google Scholar]
- Hohle, M. M., Haberl, F., Vink, J., de Vries, C. P., & Neuhäuser, R. 2012, MNRAS, 419, 1525 [NASA ADS] [CrossRef] [Google Scholar]
- Jansen, F., Lumb, D., Altieri, B., et al. 2001, A&A, 365, L1 [NASA ADS] [CrossRef] [EDP Sciences] [Google Scholar]
- Kaplan, D. L. 2008, in 40 Years of Pulsars: Millisecond Pulsars, Magnetars and More, eds. C. Bassa, Z. Wang, A. Cumming, & V. M. Kaspi, AIP Conf. Ser., 983, 331 [Google Scholar]
- Kaplan, D. L., & van Kerkwijk, M. H. 2009, ApJ, 705, 798 [NASA ADS] [CrossRef] [Google Scholar]
- Kaplan, D. L., & van Kerkwijk, M. H. 2011, ApJ, 740, L30 [NASA ADS] [CrossRef] [Google Scholar]
- Kaplan, D. L., Esposito, P., Chatterjee, S., et al. 2009, MNRAS, 400, 1445 [NASA ADS] [CrossRef] [Google Scholar]
- Kaplan, D. L., Kamble, A., van Kerkwijk, M. H., & Ho, W. C. G. 2011, ApJ, 736, 117 [NASA ADS] [CrossRef] [Google Scholar]
- Keane, E. F., & McLaughlin, M. A. 2011, BASI, 39, 333 [Google Scholar]
- Keane, E. F., Ludovici, D. A., Eatough, R. P., et al. 2010, MNRAS, 401, 1057 [NASA ADS] [CrossRef] [Google Scholar]
- Keane, E. F., Kramer, M., Lyne, A. G., Stappers, B. W., & McLaughlin, M. A. 2011, MNRAS, 415, 3065 [NASA ADS] [CrossRef] [Google Scholar]
- Kondratiev, V. I., McLaughlin, M. A., Lorimer, D. R., et al. 2009, ApJ, 702, 692 [NASA ADS] [CrossRef] [Google Scholar]
- Lai, D. 2001, Rev. Mod. Phys., 73, 629 [NASA ADS] [CrossRef] [Google Scholar]
- Lorimer, D. R., McLaughlin, M. A., Arzoumanian, Z., et al. 2004, MNRAS, 347, L21 [NASA ADS] [CrossRef] [Google Scholar]
- Lyne, A. G., McLaughlin, M. A., Keane, E. F., et al. 2009, MNRAS, 400, 1439 [NASA ADS] [CrossRef] [Google Scholar]
- Manchester, R. N., Hobbs, G. B., Teoh, A., & Hobbs, M. 2005, AJ, 129, 1993 [NASA ADS] [CrossRef] [Google Scholar]
- McLaughlin, M. A., Lyne, A. G., Lorimer, D. R., et al. 2006, Nature, 439, 817 [NASA ADS] [CrossRef] [PubMed] [Google Scholar]
- McLaughlin, M. A., Rea, N., Gaensler, B. M., et al. 2007, ApJ, 670, 1307 [NASA ADS] [CrossRef] [Google Scholar]
- Mereghetti, S. 2008, A&A Rev., 15, 225 [NASA ADS] [CrossRef] [Google Scholar]
- Mori, K., Chonko, J. C., & Hailey, C. J. 2005, ApJ, 631, 1082 [NASA ADS] [CrossRef] [Google Scholar]
- Motch, C., Sekiguchi, K., Haberl, F., et al. 2005, A&A, 429, 257 [NASA ADS] [CrossRef] [EDP Sciences] [Google Scholar]
- Motch, C., Pires, A. M., Haberl, F., Schwope, A., & Zavlin, V. E. 2009, A&A, 497, 423 [NASA ADS] [CrossRef] [EDP Sciences] [Google Scholar]
- Ng, C.-Y., Kaspi, V. M., Dib, R., et al. 2011, ApJ, 729, 131 [NASA ADS] [CrossRef] [Google Scholar]
- Page, D. 1998, in NATO ASIC Proc. 515: The Many Faces of Neutron Stars., eds. R. Buccheri, J. van Paradijs, & A. Alpar, 539 [Google Scholar]
- Page, D., Prakash, M., Lattimer, J. M., & Steiner, A. W. 2011, Phys. Rev. Lett., 106, 081101 [NASA ADS] [CrossRef] [MathSciNet] [PubMed] [Google Scholar]
- Pavlov, G. G., Shibanov, Y. A., Zavlin, V. E., & Meyer, R. D. 1995, in The Lives of the Neutron Stars, eds. M. A. Alpar, U. Kiziloglu, & J. van Paradijs, 71 [Google Scholar]
- Pellizzoni, A., Pilia, M., Possenti, A., et al. 2009a, ApJ, 695, L115 [NASA ADS] [CrossRef] [Google Scholar]
- Pellizzoni, A., Pilia, M., Possenti, A., et al. 2009b, ApJ, 691, 1618 [NASA ADS] [CrossRef] [Google Scholar]
- Pires, A. M. 2009, Ph.D. Thesis, Population study of radio-quiet and thermally emitting isolated neutron stars, University of Strasbourg and University of Sao Paulo, 280 [Google Scholar]
- Pires, A. M., Motch, C., & Janot-Pacheco, E. 2009a, A&A, 504, 185 [NASA ADS] [CrossRef] [EDP Sciences] [Google Scholar]
- Pires, A. M., Motch, C., Turolla, R., Treves, A., & Popov, S. B. 2009b, A&A, 498, 233 [NASA ADS] [CrossRef] [EDP Sciences] [Google Scholar]
- Pittori, C., Verrecchia, F., Chen, A. W., et al. 2009, A&A, 506, 1563 [NASA ADS] [CrossRef] [EDP Sciences] [Google Scholar]
- Pons, J. A., Miralles, J. A., & Geppert, U. 2009, A&A, 496, 207 [NASA ADS] [CrossRef] [EDP Sciences] [Google Scholar]
- Popov, S. B., Colpi, M., Prokhorov, M. E., Treves, A., & Turolla, R. 2003, A&A, 406, 111 [NASA ADS] [CrossRef] [EDP Sciences] [Google Scholar]
- Popov, S. B., Pons, J. A., Miralles, J. A., Boldin, P. A., & Posselt, B. 2010, MNRAS, 401, 2675 [NASA ADS] [CrossRef] [Google Scholar]
- Posselt, B., Popov, S. B., Haberl, F., et al. 2007, Ap&SS, 308, 171 [NASA ADS] [CrossRef] [Google Scholar]
- Posselt, B., Popov, S. B., Haberl, F., et al. 2008, A&A, 482, 617 [NASA ADS] [CrossRef] [EDP Sciences] [Google Scholar]
- Predehl, P., & Schmitt, J. H. M. M. 1995, A&A, 293, 889 [NASA ADS] [Google Scholar]
- Predehl, P., Andritschke, R., Böhringer, H., et al. 2010, in SPIE Conf. Ser., 7732 [Google Scholar]
- Raymond, J. C., & Smith, B. W. 1977, ApJS, 35, 419 [NASA ADS] [CrossRef] [Google Scholar]
- Reynolds, S. P., Borkowski, K. J., Gaensler, B. M., et al. 2006, ApJ, 639, L71 [NASA ADS] [CrossRef] [Google Scholar]
- Rutledge, R. E., Fox, D. W., Bogosavljevic, M., & Mahabal, A. 2003, ApJ, 598, 458 [NASA ADS] [CrossRef] [Google Scholar]
- Rutledge, R. E., Fox, D. B., & Shevchuk, A. H. 2008, ApJ, 672, 1137 [NASA ADS] [CrossRef] [Google Scholar]
- Sanwal, D., Pavlov, G. G., Zavlin, V. E., & Teter, M. A. 2002, ApJ, 574, L61 [NASA ADS] [CrossRef] [Google Scholar]
- Seward, F. D., Forman, W. R., Giacconi, R., et al. 1979, ApJ, 234, L55 [NASA ADS] [CrossRef] [Google Scholar]
- Shabaltas, N., & Lai, D. 2012, ApJ, 48, 148 [NASA ADS] [CrossRef] [Google Scholar]
- Shternin, P. S., Yakovlev, D. G., Heinke, C. O., Ho, W. C. G., & Patnaude, D. J. 2011, MNRAS, 412, L108 [NASA ADS] [Google Scholar]
- Smith, N. 2006a, MNRAS, 367, 763 [NASA ADS] [CrossRef] [Google Scholar]
- Smith, N. 2006b, ApJ, 644, 1151 [NASA ADS] [CrossRef] [Google Scholar]
- Smith, N., & Brooks, K. J. 2008, The Carina Nebula: A Laboratory for Feedback and Triggered Star Formation, ed. B. Reipurth, 138 [Google Scholar]
- Smith, N., Bally, J., & Walborn, N. R. 2010a, MNRAS, 405, 1153 [NASA ADS] [Google Scholar]
- Smith, N., Povich, M. S., Whitney, B. A., et al. 2010b, MNRAS, 406, 952 [NASA ADS] [Google Scholar]
- Speagle, J. S., Kaplan, D. L., & van Kerkwijk, M. H. 2011, ApJ, 743, 183 [NASA ADS] [CrossRef] [Google Scholar]
- Stetson, P. B. 1987, PASP, 99, 191 [NASA ADS] [CrossRef] [Google Scholar]
- Strüder, L., Briel, U., Dennerl, K., et al. 2001, A&A, 365, L18 [NASA ADS] [CrossRef] [EDP Sciences] [Google Scholar]
- Tavani, M., Barbiellini, G., Argan, A., et al. 2009, A&A, 502, 995 [NASA ADS] [CrossRef] [EDP Sciences] [Google Scholar]
- The Fermi-LAT Collaboration 2012, ApJS, 199, 31 [NASA ADS] [CrossRef] [Google Scholar]
- Tody, D. 1986, in SPIE Conf. Ser., 627, ed. D. L. Crawford, 733 [Google Scholar]
- Townsley, L. K., Broos, P. S., Chu, Y.-H., et al. 2011a, ApJS, 194, 15 [NASA ADS] [CrossRef] [Google Scholar]
- Townsley, L. K., Broos, P. S., Corcoran, M. F., et al. 2011b, ApJS, 194, 1 [NASA ADS] [CrossRef] [EDP Sciences] [Google Scholar]
- Turner, M. J. L., Abbey, A., Arnaud, M., et al. 2001, A&A, 365, L27 [NASA ADS] [CrossRef] [EDP Sciences] [Google Scholar]
- Turner, M. L., Rutledge, R. E., Letcavage, R., Shevchuk, A. S. H., & Fox, D. B. 2010, ApJ, 714, 1424 [NASA ADS] [CrossRef] [Google Scholar]
- Turolla, R. 2009, in Astrophys. Space Sci. Lib. 357, ed. W. Becker, 141 [Google Scholar]
- Turolla, R., Zane, S., Pons, J. A., Esposito, P., & Rea, N. 2011, ApJ, 740, 105 [NASA ADS] [CrossRef] [Google Scholar]
- van Kerkwijk, M. H., & Kaplan, D. L. 2007, Ap&SS, 308, 191 [NASA ADS] [CrossRef] [Google Scholar]
- van Kerkwijk, M. H., & Kulkarni, S. R. 2001, A&A, 380, 221 [NASA ADS] [CrossRef] [EDP Sciences] [Google Scholar]
- Voges, W., Aschenbach, B., Boller, T., et al. 1999, A&A, 349, 389 [NASA ADS] [Google Scholar]
- Walborn, N. R., Smith, N., Howarth, I. D., et al. 2007, PASP, 119, 156 [NASA ADS] [CrossRef] [Google Scholar]
- Wang, J., Feigelson, E. D., Townsley, L. K., et al. 2011, ApJS, 194, 11 [NASA ADS] [CrossRef] [Google Scholar]
- Wilms, J., Allen, A., & McCray, R. 2000, ApJ, 542, 914 [NASA ADS] [CrossRef] [Google Scholar]
- Yakovlev, D. G., & Pethick, C. J. 2004, ARA&A, 42, 169 [NASA ADS] [CrossRef] [EDP Sciences] [MathSciNet] [Google Scholar]
- Zane, S., Haberl, F., Israel, G. L., et al. 2011, MNRAS, 410, 2428 [NASA ADS] [CrossRef] [Google Scholar]
- Zavlin, V. E., Pavlov, G. G., & Shibanov, Y. A. 1996, A&A, 315, 141 [NASA ADS] [Google Scholar]
All Tables
Instrumental configuration and duration of the EPIC scientific exposures of the XMM-Newton observation of 2XMM J104608.7-594306.
Parameters of 2XMM J104608.7-594306, as extracted from the XMM-Newton AO9 observations.
All Figures
|
Fig. 1 Results of the |
| In the text | |
|
Fig. 2 Our |
| In the text | |
|
Fig. 3 Left. Significance of the |
| In the text | |
|
Fig. 4 Background-subtracted light curve for pn, folded at the spin period P ∗ ~ 18.6 ms. The energy band is 0.35–2 keV and the size of the extraction region is 18.85″. |
| In the text | |
|
Fig. 5 Results of spectral fitting of source J1046. We show the pn data and folded best-fit blackbody model, with residuals. Left. Simple blackbody. Right. Best-fit with oxygen overabundance and a Gaussian absorption line at energy ϵ ~ 1.35 keV. |
| In the text | |
|
Fig. 6 V (left) and Hα (right) images of the field of source J1046. An inverted colour map is used, i.e. brighter objects are darker. The 90% confidence level error circle on the position of the source is of size 0.86″. The images were smoothed using a Gaussian filter of one pixel in size. |
| In the text | |
|
Fig. 7 ESO-MAMA wide-field R band image of the area around J1046 (marked by a cross), in the direction of the Carina Nebula. The young OB associations Tr 16 and Tr 14, as well as η Car, are located NW of the source, towards the bright diffuse emission. |
| In the text | |
|
Fig. 8 Blackbody luminosity vs. emission radius (left) and emission radius vs. neutron star spin period (right) for several populations of thermally emitting INSs (see text). |
| In the text | |
Current usage metrics show cumulative count of Article Views (full-text article views including HTML views, PDF and ePub downloads, according to the available data) and Abstracts Views on Vision4Press platform.
Data correspond to usage on the plateform after 2015. The current usage metrics is available 48-96 hours after online publication and is updated daily on week days.
Initial download of the metrics may take a while.