Fig. 2
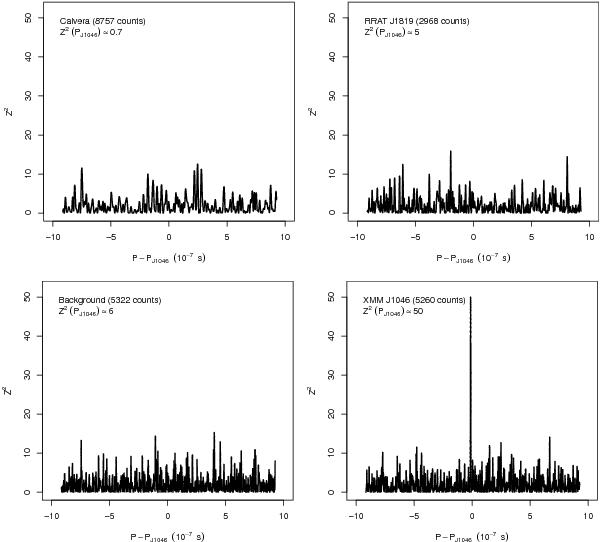
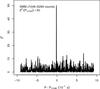
Our  analysis around the periodicity at P∗ ~ 18.6 ms. The frequency range is 5.3 × 10⁻² Hz and the step in frequency is 0.1 μHz; the energy band is 0.36–2.2 keV and the size of the extraction region is 18.85″. We present the results of the same analysis for different data sets observed in SW mode: at top left, we show the periodogram for Calvera (obsid 0601180201; 8757 total counts); at top right, we show that for RRAT J1819-1458 (obsid 0406450201; 2968 total counts). Below are the periodograms for our data: at the left we provide results for events extracted from a background region (5322 total counts for an extraction region of size 52″) and on the right, for J1046 (total of 5260 counts).
Current usage metrics show cumulative count of Article Views (full-text article views including HTML views, PDF and ePub downloads, according to the available data) and Abstracts Views on Vision4Press platform.
Data correspond to usage on the plateform after 2015. The current usage metrics is available 48-96 hours after online publication and is updated daily on week days.
Initial download of the metrics may take a while.