Fig. 6
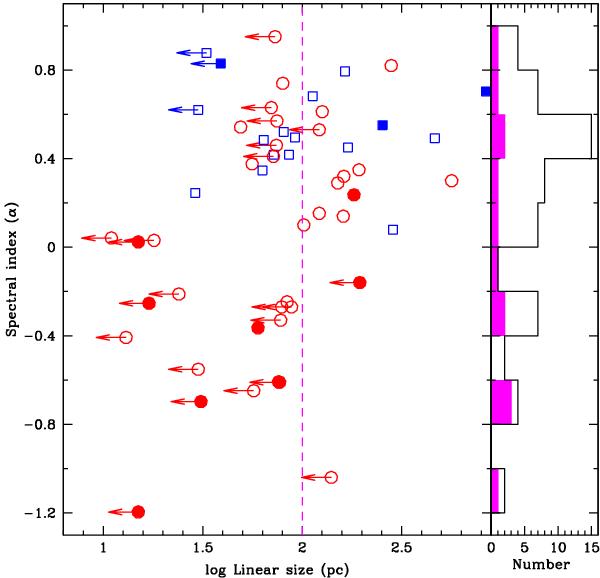
Spectral index (α) vs. linear size (in pc) at the absorber redshift for the quasars with the milliarcsecond scale images. The α are from the arcsecond scale images. Systems towards the quasars with no “core” identifications are plotted as squares. The point for the system towards the quasar B1629+120 that has α = +0.54 and LLS = 7.2 kpc is not plotted to keep the x-axis short. The histogram for the α is also shown. The filled symbols and shaded histogram are for 21-cm detections.
Current usage metrics show cumulative count of Article Views (full-text article views including HTML views, PDF and ePub downloads, according to the available data) and Abstracts Views on Vision4Press platform.
Data correspond to usage on the plateform after 2015. The current usage metrics is available 48-96 hours after online publication and is updated daily on week days.
Initial download of the metrics may take a while.