Fig. 4
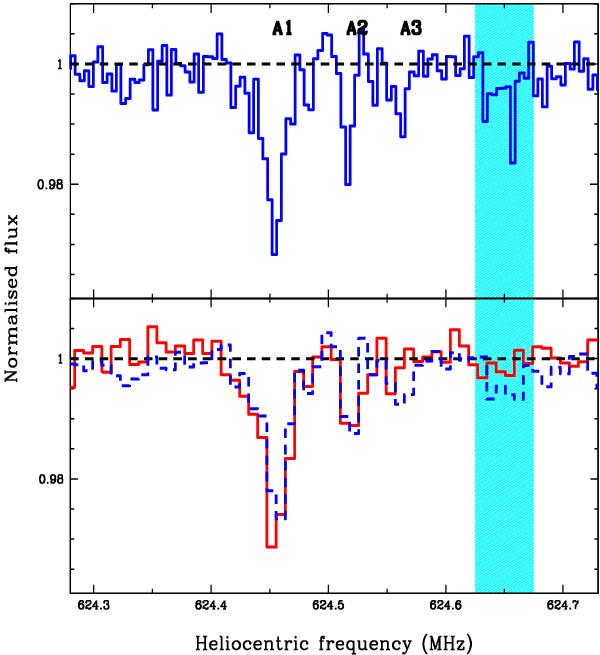
21-cm absorption spectra of zabs = 1.2753 Mg ii absorber towards J1408 − 0752. Top panel shows the higher resolution (1.9 km s-1) spectrum taken on 22/1/2010 and bottom panel shows the lower resolution (3.8 km s-1) spectrum taken on 21/6/2009. The 22/1/2010 spectrum smoothed to the resolution of 21/6/2009 spectrum is also plotted (dashed line) in the bottom panel. The shaded region corresponds to the RFI affected spectral range in the higher resolution spectrum.
Current usage metrics show cumulative count of Article Views (full-text article views including HTML views, PDF and ePub downloads, according to the available data) and Abstracts Views on Vision4Press platform.
Data correspond to usage on the plateform after 2015. The current usage metrics is available 48-96 hours after online publication and is updated daily on week days.
Initial download of the metrics may take a while.