Fig. 13
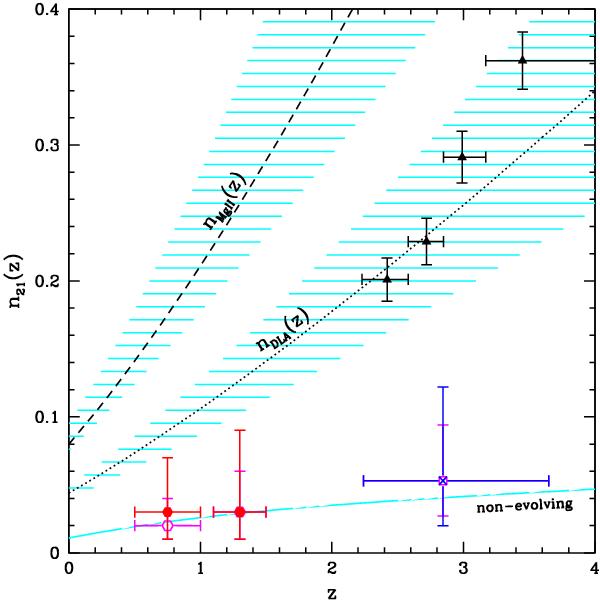
Number of 21-cm absorbers per unit redshift range, n21(z), for  = 0.3 km s-1. Open circles are for no correction for partial coverage. Filled circles correspond to n21 after the optical depths have been corrected for partial coverage assuming fc = cf. The n21 based on DLAs at z > 2 are plotted as squares and crosses with the latter corresponding to values after correcting for partial coverage. The curve for non-evolving population of 21-cm absorbers normalized at n21 (z = 1.3) is also plotted. Lines and dashed areas show the number of absorbers per unit redshift for DLAs (Rao et al. 2006,dotted line) and strong Mg ii absorbers (Prochter et al. 2006,dashed line). Triangles are the number per unit redshift of DLAs measured from the sample of Noterdaeme et al. (2009b).
Current usage metrics show cumulative count of Article Views (full-text article views including HTML views, PDF and ePub downloads, according to the available data) and Abstracts Views on Vision4Press platform.
Data correspond to usage on the plateform after 2015. The current usage metrics is available 48-96 hours after online publication and is updated daily on week days.
Initial download of the metrics may take a while.