Fig. 12
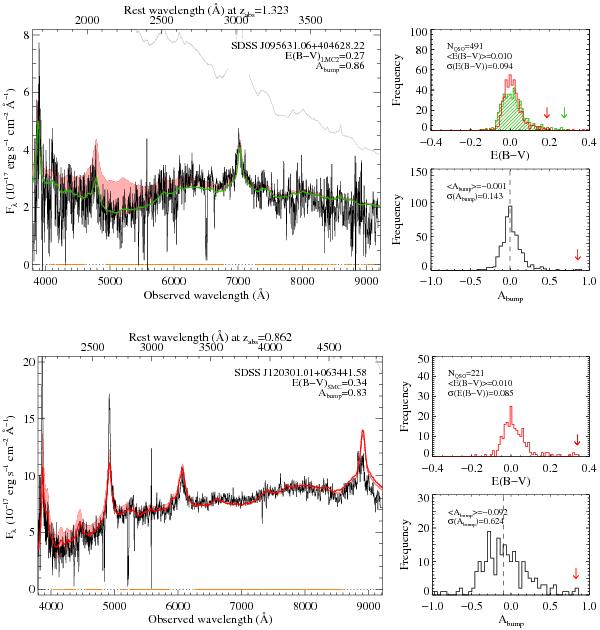
Fitting the spectral energy distribution of J0956+4046 (top) and J1203+0634 (bottom). The SDSS spectrum (black) and the unreddened SDSS composite (gray) from Vanden Berk et al. (2001). The best extinction modelling is obtained for E(B − V) = 0.27 and a LMC2 extinction law for J0956+4046 (resp. E(B − V) = 0.34 and SMC law for J1203+0634) at the redshift of the absorber. The shaded area represents Abump, the difference between the best model using Jiang et al. (2011) parametrisation with and without bump. The orange regions at y = 0 indicate the spectral range considered in the fitting process. The right panels show the distributions of E(B − V) (using SMC-law: red, LMC2: green hashed) and Abump obtained for a control sample of SDSS QSOs (Schneider et al. 2010) within Δz = ± 0.004 from J0956+4046 (resp. J1203+0634). The arrows indicate the positions of the considered QSO.

Current usage metrics show cumulative count of Article Views (full-text article views including HTML views, PDF and ePub downloads, according to the available data) and Abstracts Views on Vision4Press platform.
Data correspond to usage on the plateform after 2015. The current usage metrics is available 48-96 hours after online publication and is updated daily on week days.
Initial download of the metrics may take a while.