Fig. 11
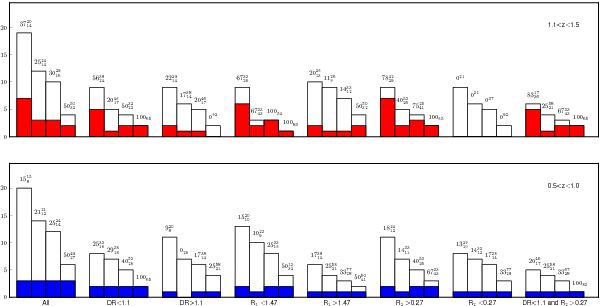
Distribution of the number of Mg ii systems for different subsamples from the sample S2 with the “core” identification. Systems at 1.1 < z < 1.5 are plotted in the top panel and systems at 0.5 < z < 1 in the bottom panel. Shaded histogram corresponds to detections and optical depths have been corrected for partial coverage assuming fc = cf. For each subsample four bars correspond to no-cutoff,  = 0.3, 0.2 and 0.1 km s-1 respectively going from left to right. Detection rate, C, in each case is given at the top of bar.
Current usage metrics show cumulative count of Article Views (full-text article views including HTML views, PDF and ePub downloads, according to the available data) and Abstracts Views on Vision4Press platform.
Data correspond to usage on the plateform after 2015. The current usage metrics is available 48-96 hours after online publication and is updated daily on week days.
Initial download of the metrics may take a while.