Fig. 8
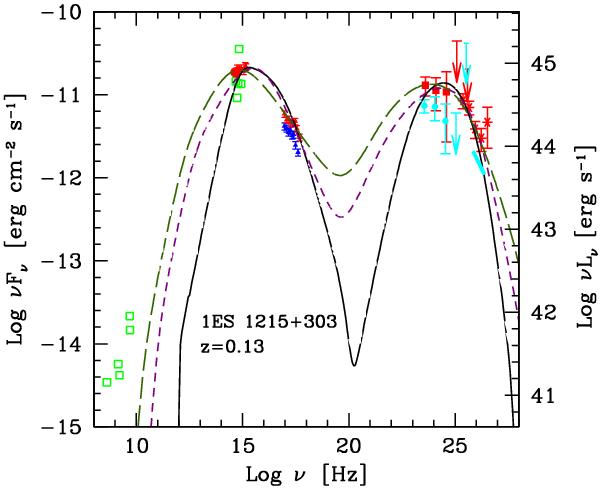
Spectral energy distribution of 2011 January − February data (dark (red) symbols) modeled with the one-zone SSC model of Maraschi & Tavecchio (2003). From high to low energies: the deabsorbed MAGIC spectra (asterisk, see text), the Fermi-LAT data (filled squares), Swift/XRT and Swift/UVOT data (triangles: upper (red) for MJD 55 569, lower (blue) for MJD 55 565) and simultaneous KVA data (filled circle, host galaxy subtracted, see text). The light (cyan) symbols report the January − June data of Fermi-LAT (data points and arrows) and MAGIC (the thick oblique line). The (green) open squares are archival data. The dashed line is the model fit using the extreme Doppler factor δ = 60, while the solid line is the model fit with high γmin and the long dashed line reports the model parameters that produces with smallest χ2 (see text and Table 2).
Current usage metrics show cumulative count of Article Views (full-text article views including HTML views, PDF and ePub downloads, according to the available data) and Abstracts Views on Vision4Press platform.
Data correspond to usage on the plateform after 2015. The current usage metrics is available 48-96 hours after online publication and is updated daily on week days.
Initial download of the metrics may take a while.