Fig. B.1
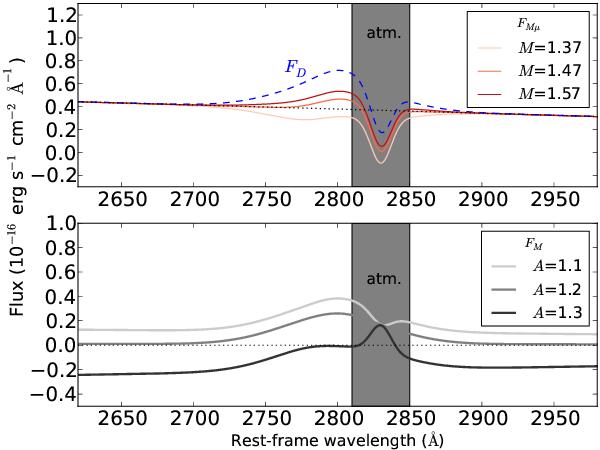
Macro-micro decomposition (MmD) applied to simulated spectra of HE 0435-1223 mimicking the observed data. The decomposition is similar to the one showed in Fig. 3. The bottom panel shows FM for three different values of A and an arbitrary value of M. The best value of A is A ~ 1.2 because it leads to FM = 0 in the continuum regions blueward and redward of the emission line. The upper panel shows the decomposition for 3 different values of M. The best value is M = 1.47 because it minimizes the emission in the line, keeping the flux above the apparent local continuum depicted as a dotted black line.
Current usage metrics show cumulative count of Article Views (full-text article views including HTML views, PDF and ePub downloads, according to the available data) and Abstracts Views on Vision4Press platform.
Data correspond to usage on the plateform after 2015. The current usage metrics is available 48-96 hours after online publication and is updated daily on week days.
Initial download of the metrics may take a while.