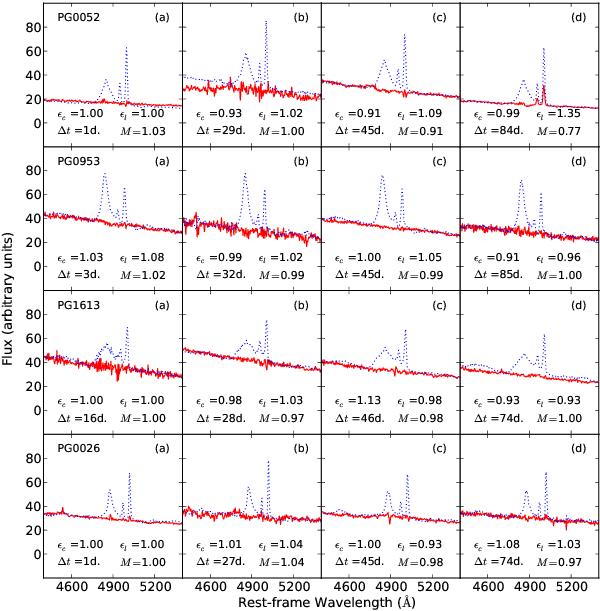
Fig. A.1

Application of the MmD method for H β & [O III] for mock lensed quasars simulated based on spectro-photometric monitoring data of Palomar-Green quasars. For each pair of spectra separated by a delay Δt, the continuum of one of the spectra has been artificially microlensed by μ = 1.5 and M = 1 has been assumed. For legibility, only the fraction FMμ (red solid line) and the reference spectrum (blue dotted line) are shown. Each row corresponds to a different object. The time-delay between the pairs of spectra is increasing from panel a) to d). For each panel, we provide M retrieved with the decomposition, the variability in the continuum ϵc and in the line ϵl.
Current usage metrics show cumulative count of Article Views (full-text article views including HTML views, PDF and ePub downloads, according to the available data) and Abstracts Views on Vision4Press platform.
Data correspond to usage on the plateform after 2015. The current usage metrics is available 48-96 hours after online publication and is updated daily on week days.
Initial download of the metrics may take a while.


