Fig. 1
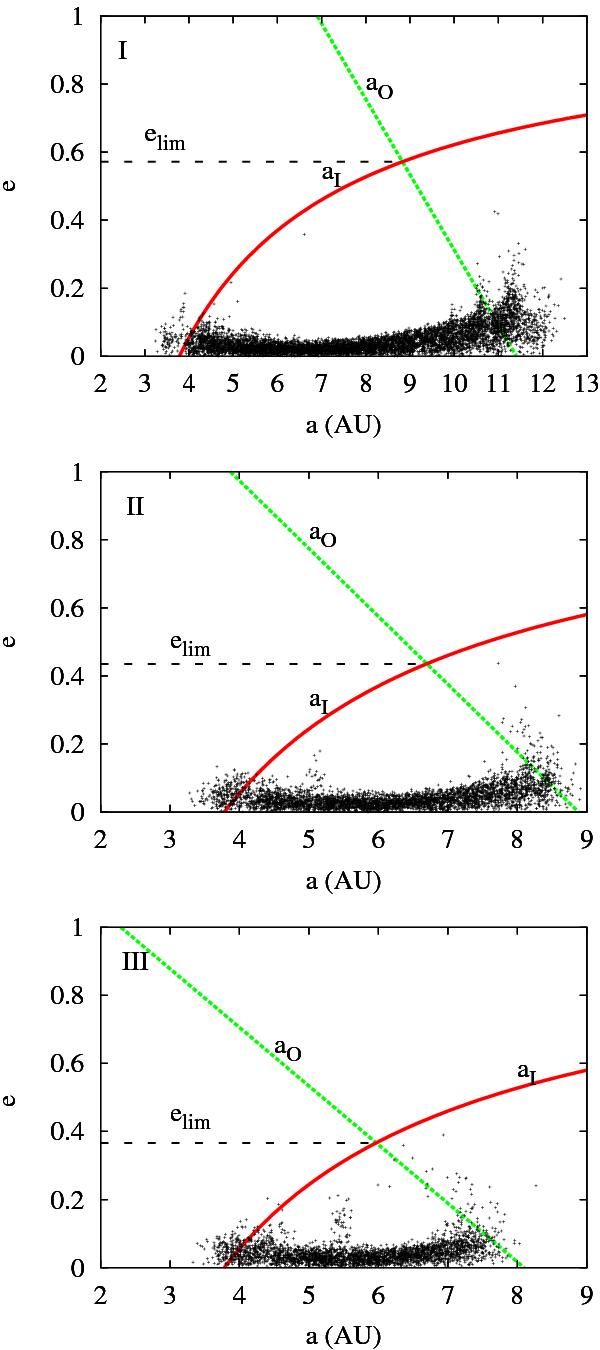
Region of stability of the particles in the space of a versus e for the coplanar case (IA = i = 0). The plots represent the final results for the orbital configurations I, II and III. The red and green curves give the analytical estimates for the stability region (“protected region”). These curves represent the internal, aI and outer, aO, critical semi-major axes. The red and green curves are given by Eqs. (4) and (3), respectively. The dashed curve represent the (alim, elim) pair for a particle within the “protected region”.
Current usage metrics show cumulative count of Article Views (full-text article views including HTML views, PDF and ePub downloads, according to the available data) and Abstracts Views on Vision4Press platform.
Data correspond to usage on the plateform after 2015. The current usage metrics is available 48-96 hours after online publication and is updated daily on week days.
Initial download of the metrics may take a while.