Fig. 8
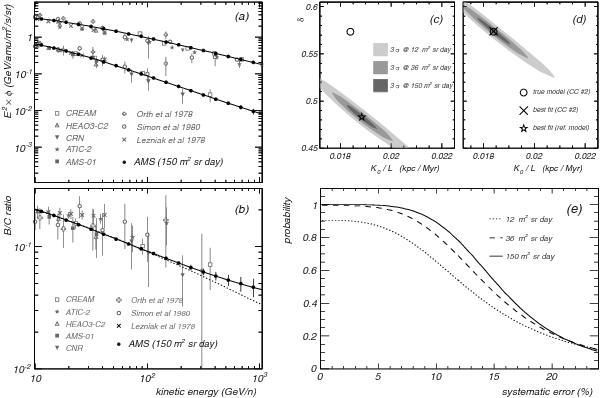
AMS-02 mock data for the elemental fluxes φB and φCa) and their ratio b), using the input model CC # 2 of Table 2 and assuming a detector exposure factor F = 150 m2 sr day. The error bars are only statistics. The constraints to the transport parameters provided by the AMS-02 mock data are reported by the 3-σ contour levels for exposure factors of F = 12, 36, and 150 m2 sr day in c) and d). The data are fitted within the reference model (star in panel c) and dotted line in panel b)) and within the model CC # 2 (cross in panel d) and solid line in panel b)). The AMS-02 discrimination probability between the two models as a function of the systematic error in the measurement is shown in d) for F = 12, 36, and 150 m2 sr day. The systematic errors are assumed to be energy-independent.
Current usage metrics show cumulative count of Article Views (full-text article views including HTML views, PDF and ePub downloads, according to the available data) and Abstracts Views on Vision4Press platform.
Data correspond to usage on the plateform after 2015. The current usage metrics is available 48-96 hours after online publication and is updated daily on week days.
Initial download of the metrics may take a while.