Fig. 3
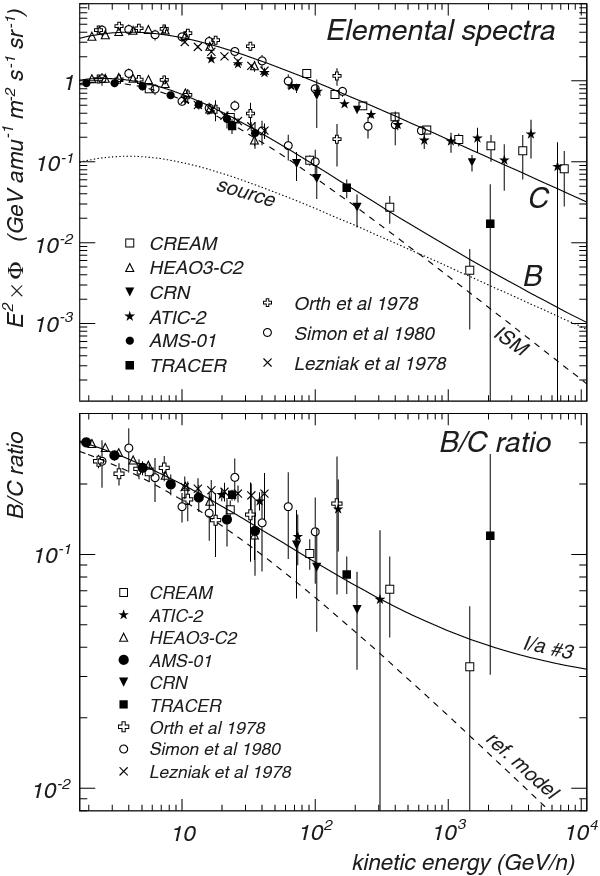
Top: individual CR spectra of B and C. Solid lines are the model predictions for I/a #3 SNR model of Table 2. Model parameters are as in Table 1, except for δ and K0/L, which are fitted to data. The boron SNR component (dotted line) and the ISM component (dashed lines) are reported. Bottom: the B/C ratio from the above model (solid line) and when fragmentation in SNR is turned off (dashed line). Data are from HEAO3-C2 (Engelmann et al. 1990), CREAM (Ahn et al. 2009), AMS-01 (Aguilar et al. 2010), TRACER (Obermeier et al. 2011), ATIC-2 (Panov et al. 2007), CRN (Müller et al. 1991), Simon et al. (1980), Lezniak & Webber (1978), and Orth et al. (1978).
Current usage metrics show cumulative count of Article Views (full-text article views including HTML views, PDF and ePub downloads, according to the available data) and Abstracts Views on Vision4Press platform.
Data correspond to usage on the plateform after 2015. The current usage metrics is available 48-96 hours after online publication and is updated daily on week days.
Initial download of the metrics may take a while.