| Issue |
A&A
Volume 544, August 2012
|
|
|---|---|---|
| Article Number | A118 | |
| Number of page(s) | 9 | |
| Section | Astrophysical processes | |
| DOI | https://doi.org/10.1051/0004-6361/201218900 | |
| Published online | 09 August 2012 | |
XMM-Newton observations of four high mass X-ray binaries and IGR J17348−2045
1 ISDC Data Centre for Astrophysics, University of Geneva, Chemin d’Ecogia 16, 1290 Versoix, Switzerland
e-mail: This email address is being protected from spambots. You need JavaScript enabled to view it.
2 International Space Science Institute (ISSI) Hallerstrasse 6, 3012 Bern, Switzerland
3 INAF – Osservatorio Astronomico di Brera, via Emilio Bianchi 46, 23807 Merate (LC), Italy
4 INAF – Osservatorio Astronomico di Roma, via Frascati 33, 00044 Rome, Italy
Received: 27 January 2012
Accepted: 13 July 2012
Abstract
We present the results of the XMM-Newton observations of five hard X-ray emitters: IGR J08262−3736, IGR J17354−3255, IGR J16328−4726, SAX J1818.6−1703, and IGR J17348−2045. The first source is a confirmed supergiant high mass X-ray binary, the following two are candidates supergiant fast X-ray transients, SAX J1818.6−1703 is a confirmed supergiant fast X-ray transient and IGR J17348−2045 is one of the still unidentified objects discovered with INTEGRAL. The XMM-Newton observations permitted the first detailed soft X-ray spectral and timing study of IGR J08262−3736 and provided further support in favor of the association of IGR J17354−3255 and IGR J16328−4726 with the supergiant fast X-ray transients. SAX J1818.6−1703 was not detected by XMM-Newton, thus supporting the idea that this source reaches its lowest X-ray luminosity ( ≃ 1032 erg s-1) around apastron. For IGR J17348−2045 we identified for the first time the soft X-ray counterpart and proposed the association with a close-by radio object, suggestive of an extragalactic origin.
Key words: stars: emission-line, Be / X-rays: binaries / gamma rays: stars
© ESO, 2012
1. Introduction
High-mass X-ray binaries (HMXBs) comprise a compact object orbiting a massive OB star. The compact object, usually a neutron star (NS), emits a conspicuous amount of X-ray radiations (up to luminosities of ~1037 erg s-1) due to the accretion of matter from the OB companion. Depending on the nature of the companion star, HMXBs can be divided into Be X-ray binaries (BeXBs) and supergiant X-ray binaries (SGXBs).
In the former, the NS is in a wide eccentric orbit around a Be star. The X-ray luminosity is generally low (~1032−1033 erg s-1) when the NS is far away from periastron and accretes matter from low density regions. Remarkable increases in the X-ray luminosity (ΔLX ~ 100–1000) are displayed: (i) during the so-called “Type-II” X-ray outbursts, which last several orbital cycles and present few (if any) X-ray flux variations associated to the orbital phase; (ii) at the periastron (“Type I” outbursts), where the compact object is closer to the companion and accretion takes place through the low-velocity and high-density wind of the Be star (Stella et al. 1986; Reig 2011).
In the SGXBs, the compact object moves around an early-type supergiant in a nearly circular orbit, and in some cases it is well embedded in its dense highly supersonic wind (the so-called “highly obscured” SGXBs). The X-ray luminosity is powered by the accretion of the strong stellar wind onto the compact star and displays, on-average, less pronounced changes along the orbit with respect to the BeXBs. Hydrodynamic instabilities in the wind of the supergiant star can give rise to significant density gradients in the environment around the NS, leading to aperiodic variations of the X-ray luminosity (ΔLX ~ 10–50) on time-scales ranging from few to thousands of seconds (Negueruela 2010). The accretion of particularly dense “clumps” in the wind can also induce bright short flares that can last for a few hours (see, e.g., Kreykenbohm et al. 2008, and references therein).
A few peculiar SGXBs, sharing with the latter a remarkable number of similarities (orbital period, energy spectra, properties of the companion stars; see e.g. discussion in Bozzo et al. 2010), were discovered in the late 90s (see e.g., Yamauchi et al. 1995; Smith et al. 1998), and collectively termed later “supergiant fast X-ray transients” (SFXTs; Sguera et al. 2006; Negueruela et al. 2006). At odds with the “classical” SGXBs, the SFXTs spend a large fraction of their time (Romano et al. 2011) in a quiescent state with a typical luminosity of 1032–1033 erg s-1, and only sporadically undergo bright outbursts (ΔLX ~ 104–105) lasting a few hours and reaching peak luminosities comparable with those of the persistent SGXBs (LX ~ 1037 erg s-1; see e.g., Walter & Zurita Heras 2007). The outbursts of SFXTs are associated to the accretion of particularly dense clumps as in other SGXBs, but the origin of the lower persistent luminosity and much more pronounced variability of these sources is still a matter of debate (in ’t Zand 2005; Walter & Zurita Heras 2007; Grebenev & Sunyaev 2007; Bozzo et al. 2008c, 2011).
In this paper, we report on the XMM-Newton observations of four HMXBs discovered with INTEGRAL and BeppoSAX. Among these sources, IGR J08262−3736 is classified as a classical SGXB, IGR J17354−3255 and IGR J16328−4726 are candidate SFXTs, and SAX J1818.6−1703 is a confirmed SFXT. We also report on the XMM-Newton observation of the still unclassified INTEGRAL source IGR J17348−2045. A summary of the previous results for all the above sources is presented in Sect. 2, while our analysis and results of the XMM-Newton observations are presented in Sect. 3. Discussions and conclusions on the properties of the soft X-ray emission from the five objects are reported in Sect. 4.
2. The selected sources
2.1. IGR J08262−3736
IGR J08262−3736 was discovered by the hard X-ray imager IBIS/ISGRI on-board the INTEGRAL satellite and reported for the first time in the fourth ISGRI catalog (Bird et al. 2010). The measured fluxes of the source were 0.4 ± 0.1 mCrab in the 20−40 keV energy band and 0.7 ± 0.2 mCrab in the 40−100 keV energy range1 (Bird et al. 2010).
Masetti et al. (2010) tentatively associated the source to the OB-V star SS 188 located at a distance of 6.1 kpc, thus suggesting that IGR J08262−3736 was a new member of the HMXB class discovered with INTEGRAL. The association was later confirmed by Malizia et al. (2011) using Swift/XRT data. The best determined XRT position is at RA(J2000) = 08h26m13.87s and Dec(J2000) = –37°37′11.03′′, with an associated uncertainty of 4 arcsec. The XRT spectrum could be well fit by using an absorbed power-law model with an absorption column density of NH = 1.5 × 1022 cm-2 and a power-law photon index of Γ = 2. The estimated flux in the 2−10 keV energy band was ~ 10-11 erg/cm2/s, corresponding to an X-ray luminosity of ~ 2.4 × 1033 erg s-1.
2.2. IGR J17354−3255
IGR J17354−3255 was discovered with INTEGRAL in 2006 during a monitoring observation of the Galactic bulge region (Kuulkers et al. 2006), and is reported in the fourth IBIS catalogue (Bird et al. 2009) and in the 54 months Swift/BAT hard X-ray catalogue (Cusumano et al. 2010). The average X-ray fluxes in the 20–40 keV and 15–150 keV energy band are 1.1 × 10⁻¹¹ erg/cm2/s and 2.1 × 10⁻¹¹ erg/cm2/s, respectively. The long term monitoring of IGR J17354−3255 carried out with the INTEGRAL /ISGRI and Swift /BAT suggested that the source is a weak persistent emitter in the hard X-rays (average flux of 1.1 mCrab in the 18–60 keV energy band), only sporadically displaying relatively short flares with duration from few hours to ~1 day. This behaviour, together with the periodic modulation detected in the hard X-ray data at 8.4474 ± 0.0017 days, led to the conclusion that IGR J17354−3255 is a HMXB, possibly a SFXT (D’Aì et al. 2011; Sguera et al. 2011). The source is also positionally coincident with the high energy AGILE transient AGL J1734−3310, even though the localization uncertainties are still too large to claim a firm association (Bulgarelli et al. 2009).
In the soft X-ray domain, the source was observed twice with Swift /XRT and once with Chandra. In the most recent XRT observation (Vercellone et al. 2009), two sources were found within the INTEGRAL error circle of IGR J17354−3255. The first object (S1) displayed a higher flux (1.1 × 10⁻¹¹ erg/cm2/s, 0.3–10 keV) and a spectrum characterized by a blackbody temperature of kT ~ 1.4 keV and an absorption column density of NH ~ 5 × 1022 cm-2. The second source (S2) was a factor of ~20 fainter and no spectral information was available. In a previously performed XRT observation (2008 March 11), only S2 was detected at a nearly constant flux, while S1 was not detected with a 3σ upper limit on its X-ray flux a factor ≃ 30 lower than the one measured in the other XRT observation (Vercellone et al. 2009).
The presence of these two sources was confirmed also through the Chandra observation performed on 2009 February 6 (Tomsick et al. 2009a). S1 (=CXOU J173527.5−325554) was detected with an unabsorbed 0.3–10 keV flux of 1.3 × 10⁻¹¹ erg/cm2/s, and displayed an X-ray spectrum characterized by NH ~ 7.5 × 1022 cm-2 and Γ ≃ 0.54. The Chandra refined position of this source (RA(J2000) = 17h35m27.59s Dec(J2000) = –32°55′54.4′′, associated 90% c.l. uncertainty 0.64′′) led to the identification of the infrared counterpart 2MASS J17352760−3255544. No catalogued optical counterpart was found at the Chandra position, consistent with the high measured extinction in the direction of the source. In the Chandra observation, S2 (=CXOU J173518.7−325428) was detected with an X-ray flux of 1.4 × 10⁻¹² erg/cm2/s and displayed an absorbed power-law shaped spectrum with NH ~ 2.6 × 1022 cm-2 and Γ ≃ 0.79. The best estimated source position was RA(J2000) = 17h35m18.73s, Dec(J2000) = -32°54′28.7″, with an associated 90% c.l. uncertainty of 0.64′′.
The more pronounced variability of S1 led to the conclusion that this source was the most likely counterpart to IGR J17354−3255 (Vercellone et al. 2009; Tomsick et al. 2009a).
2.3. IGR J16328−4726
The source IGR J16328−4726 was discovered with INTEGRAL by Bird et al. (2007) and reported as a hard X-ray transient in the latest ISGRI and Swift /BAT catalogues (Bird et al. 2010; Cusumano et al. 2010). A relatively bright outburst from the source was detected with the Swift /BAT on 2009 June 9 (Grupe et al. 2009). The follow-up observations with the narrow field instrument on-board Swift, XRT, showed that the spectrum of the source could be well described by an absorbed power-law model with NH ≃ 8 × 1022 cm-2 and Γ ≃ 0.6. The estimated 0.3–10 keV X-ray flux was 2.4 × 10⁻¹⁰ erg/cm2/s. On that occasion, XRT followed the evolution of the X-ray flux up to 4 days after the onset of the outburst (Fiocchi et al. 2010). During the last observation performed on 2009 June 14 the source was no longer detected, resulting in a 3σ upper limit on the X-ray flux of 1.4 × 10⁻¹² erg/cm2/s (0.3–10 keV; Fiocchi et al. 2010).
From the analysis of the BAT data, Corbet et al. (2010) revealed a highly significant modulation at ~10 d. This was interpreted as the orbital period of a HMXB, possibly a supergiant system.
An accurate analysis of all the archival INTEGRAL observations performed in the direction of IGR J16328−4726 was reported by Fiocchi et al. (2010). In the hard X-ray domain (20−50 keV), two outbursts lasting a few hours were detected by the hard X-ray imager ISGRI on-board INTEGRAL. No simultaneous data were available with the two X-ray monitors JEM-X. On both occasions the ISGRI spectrum could be well fit by using a simple power-law model with Γ ≃ 2–2.6 and a flux of 2–3.3 × 10⁻¹⁰ erg/cm2/s (20–50 keV). The 3σ upper limit on the source emission outside the outbursts derived from the ISGRI data was 2.5 × 10⁻¹² erg/cm2/s (20–50 keV).
The fast flaring behaviour of the source, and its spectral properties, suggested that IGR J16328−4726 is a member of the SFXT class discovered with INTEGRAL.
2.4. SAX J1818.6−1703
SAX J1818.6−1703 is one of the confirmed SFXT sources, and was discovered by BeppoSAX on 1998 March 11 during a period of intense X-ray activity that lasted for about 2 h and reached a peak flux of ~400 mCrab (9–25 keV, in ’t Zand et al. 1998). Since then, several outbursts from the source were recorded with INTEGRAL and Swift (see, e.g. Sidoli et al. 2009, and references therein). The best X-ray source position was provided by Chandra at RA(J2000) = 18h18m37 89 and Dec(J2000) = –17°02′47.9
 (associated uncertainty 0.6′′ at 90% confidence level; in ’t Zand et al. 2006). The estimated source distance is 2.1 ± 0.1 kpc (Torrejón et al. 2010). An in-depth study of the X-ray activity of the source was carried out by Bird et al. (2009) and Zurita Heras & Chaty (2009). The first investigation determined the best orbital period of SAX J1818.6−1703 at 30 ± 0.1 d (in the following we also consider the reference phase 0 at 53 671 MJD, as reported by Bird et al. 2009). Zurita Heras & Chaty (2009) also found that most of the discovered outbursts took place when the NS passed close to the periastron, and that the source usually remains relatively bright in X-rays (a few times 10-11 erg/cm2/s) for about ~6 d around this orbital phase. However, outbursts in several periastron passages were missing. This behaviour could be reasonably well explained by assuming that the NS in SAX J1818.6−1703 has an eccentric orbit (e = 0.3–0.4) and is sporadically accreting mass from the clumpy wind of its supergiant companion (see also Sect. 1). On 2006 October 6 SAX J1818.6−1703 was also observed with XMM-Newton for the first time close to the apastron passage (phase 0.51; Bird et al. 2009), but was not detected. Bozzo et al. (2008a) determined a 3σ upper limit on its unabsorbed X-ray flux of 1.1 × 10⁻¹³ erg /cm2/ s (the effective exposure time was ~13 ks).
2.5. IGR J17348−2045
IGR J17348−2045 is an unclassified source discovered with INTEGRAL and reported for the first time by Bird et al. (2007). The best determined position of the source with ISGRI is at RA(J2000) = 17h34m57s, Dec(J2000) = –20°44.8′, with a 90% c.l. associated uncertainty of 3.6 arcmin (Bird et al. 2010). The estimated fluxes in the 20–40 keV and 40–100 keV energy bands are 0.3 ± 0.1 mCrab and 0.9 ± 0.1 mCrab, respectively.
3. Data analysis and results
For the present study we used all the available XMM-Newton observations of the five sources obtained through the guest observation programs awarded to our research group.
XMM-Newton observation data files (ODFs) were processed to produce calibrated event lists using the standard XMM-Newton Science Analysis System (v. 11.0). We used the epproc and emproc tasks to produce cleaned event files from the EPIC-pn and MOS cameras, respectively. EPIC-pn and EPIC-MOS event files were filtered in the 0.5−12 keV and 0.5−10 keV energy range, respectively, to exclude high background time intervals. The effective exposure time for each observation and camera is specified for each source in the following sections. Lightcurves and spectra for the five sources and the relative backgrounds were extracted by using regions in the same CCD. The difference in extraction areas between source and background was accounted for by using the SAS backscale task for the spectra and lccorr for the lightcurves. All EPIC spectra were rebinned before fitting in order to have at least 25 counts per bin and, at the same time, to prevent oversampling of the energy resolution by more than a factor of three. Where required, we barycenter-corrected the photon arrival times in the EPIC event files with the barycen tool. Throughout this paper, uncertainties are given at 90% c.l., unless stated otherwise.
3.1. IGR J08262−3736
XMM-Newton observed the field-of-view (FOV) around IGR J08262−3736 on 2010 October 16 for a total exposure time of ~25 ks. All three EPIC cameras were operated in full frame mode. A bright point source was detected at a position (obtained from the edetect chain tool) RA(J2000) = 08h26m137 and Dec(J2000) = –37°37′1158 (the nominal positional accuracy of the EPIC cameras is assumed hereafter to be ~2 arcsec unless otherwise stated; see discussion in Pavan et al. 2011), compatible with that of the soft X-ray counterpart of IGR J08262−3736 identified by Malizia et al. (2011). On the EPIC-pn, the source lied close to the border between two CCDs and thus we chose the extraction region in order to avoid any contribution from the CCD rim2. The source lightcurve in two energy bands is shown in Fig. 1, together with the hardness ratio. The source displayed a moderate variability, with two relatively small flares occurring about 1.5 × 10⁴ s after the beginning of the observation. The hardness ratio and the hardness intensity diagram of the source (see Figs. 1 and 2) did not show clear evidence of variations in the source spectral properties with the count-rate.
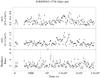 |
Fig. 1 XMM-Newton background-subtracted lightcurve of IGR J08262−3736 in two energy bands and the corresponding hardness ratio. The latter is calculated as the ratio between the source count rate in the 2–12 keV and 0.5–2 keV energy bands. The time bin is 150 s. |
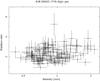 |
Fig. 2 Hardness-intensity diagram of IGR J08262−3736 obtained by using EPIC-pn data. For this plot, data were rebinned in order to have S/N ≳ 5 in each bin. |
An acceptable fit to the EPIC-pn spectrum of the source accumulated over the entire exposure time available could not be obtained using a simple absorbed power-law model ( /d.o.f. = 1.7/134). The fit was significantly improved by adding a blackbody component at the lower energies (hereafter, BB) or by the introduction of a partial covering model. In order to constrain better the spectral parameters, we also extracted the spectra from the EPIC-MOS cameras and the average INTEGRAL /ISGRI spectrum of IGR J08262−3736 (total effective exposure time 1.2 Ms) from the Heavens on-line tool3. The combined EPIC+ISGRI spectra of the source are shown in Fig. 3. The results of all the fits are reported in Table 1. A normalization constant with respect to the EPIC-pn was included in all the fits to take into account the inter-calibration between the instruments and the possible variability of the source. No significant evidence for coherent modulations was found in the EPIC data of IGR J08262−3736.
3.2. IGR J17354−3255
The FOV around IGR J17354−3255 was observed with XMM-Newton on 2011 March 6 for a total exposure time of 20 ks. The EPIC-MOS1 and EPIC-pn cameras were operated in full-frame, while the EPIC-MOS2 was in small-window mode. No significant time intervals were affected by a high flaring background, and thus in the following analysis we retained the entire exposure time available for the three instruments.
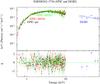 |
Fig. 3 Average XMM-Newton /EPIC and INTEGRAL /ISGRI spectra of IGR J08262−3736. The best-fit model (solid line) is obtained with a partial-covering power-law model. The residuals from the fit are shown in the bottom panel. |
Among the two candidate soft X-ray counterparts of IGR J17354−3255 identified previously with Chandra (see Sect. 2.2), S1 was not detected by the three EPIC cameras. We calculated an upper limit on the emission from the source by using the ximage tool uplimit, and a circular extraction region of 15 arcsec centered on the Chandra position of the source (see Sect. 2.2). We obtained a 3 σ upper limit on the source count-rate of 0.002 cts/sec in the 0.5–10 keV energy band (effective exposure time 19.0 ks). This corresponds to an observed X-ray flux of 7 × 10-14 erg/cm2/s (we assumed a spectral index of Γ = 1.7 and an absorption column density of NH = 7 × 1022 cm-2 as reported by D’Aì et al. 2011).
S2 was outside the EPIC-MOS2 FOV, but clearly detected by the EPIC-pn and the MOS1. In the former instrument the source was located on the gaps between two CCDs, and thus only data from the EPIC-MOS1 are considered in the following analysis. The best determined source position with the edetectchain tool is RA(J2000) = 17h35m1848 and Dec(J2000) = –32°54′302, compatible with that determined previously with Chandra (see Sect. 2.2)4. We extracted the spectrum of S2 from a circular region centered on the Chandra position of the source (Tomsick et al. 2009a). Due to the limited statistics of the data, the spectrum was grouped to have at least 5 counts per bin5 and fit with the C-statistics (Cash 1979) by using an absorbed power-law model. We fixed the absorption column density to the Galactic value expected in the direction of the source (NH ≃ 1.4 × 1022 cm-2, Kalberla et al. 2005; Dickey & Lockman 1990) and measured a power-law photon index of Γ = 0.9 ± 0.3 (C-statistics/d.o.f. = 29.4/36). The corresponding 0.5–10 keV observed flux was 2.4 × 10⁻¹³ erg/cm2/s. No significant evidence for coherent modulations was found in the EPIC data.
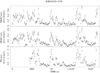 |
Fig. 4 XMM-Newton background-subtracted lightcurve of IGR J16328−4726. Data are shown in the 0.5–12 keV and 0.5−10 keV energy range for the EPIC-pn and EPIC-MOS, respectively. The time bin in all cases is 100 s. |
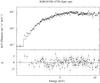 |
Fig. 5 Average XMM-Newton spectrum of IGR J16328−4726 extracted from the EPIC-pn data. The best-fit model is obtained with an absorbed power law (see text for details). The residuals from the fit are shown in the bottom panel. |
3.3. IGR J16328−4726
IGR J16328−4726 was observed by XMM-Newton on 2011 February 20 for a total exposure time of ~22 ks. Filtering for the flaring background intervals resulted in an effective exposure time of 14.7 ks for the EPIC-pn and 21 ks for the two MOS cameras. The best determined source position with the edetectchain tool is RA(J2000) = 16h32m3768 and Dec(J2000) = –47°23′39.48′′, compatible with that determined previously with Swift (Grupe et al. 2009). The lightcurves extracted from the three instruments and corrected for the background are shown in Fig. 4. The source displayed a clear variability, with relatively small flares (ΔLX ≲ 10) occurring during periods of low-level X-ray activity. The average EPIC-pn spectrum extracted during the observation is shown in Fig. 5. The best fit to this spectrum (/d.o.f. = 1.06/105) is obtained by using an absorbed power-law model. The measured absorption column density is NH = (17.5 ± 1.0) × 1022 cm-2, and the power-law photon index is Γ = 1.5 ± 0.1. The average unabsorbed 2−10 keV flux is 1.7 × 10⁻¹¹ erg/cm2/s. We searched for possible spectral variations during the rise and decay of the small flares by using the hardness-intensity diagram (HID) of the source (see Fig. 6). The Spearman rank correlation coefficient calculated for the 97 data points comprised in the plot is 0.39, thus indicating a statistically significant correlation between the HR and the source intensity (the corresponding null hypothesis probability is ≲ 10-4). We carried out a count-rate resolved spectral analysis to check this result, but did not find any significant variation of the spectral parameters (NH, Γ) with the source intensity. This can be ascribed also to the relatively low statistics of the data. We checked that this result could not be improved by fitting simultaneously pn and MOS data extracted during the same time intervals (we used the good time intervals, GTIs, of the EPIC-pn to extract simultaneous spectra from the two MOS cameras). The results of this analysis are shown in Fig. 7. We report there only the results corresponding to one particular selection of the source high and low count-rate time intervals. Different choices of these intervals did not lead to significant changes of the results.
As shown in Fig. 4, the two EPIC-MOS cameras began observing the source about 4 ks earlier than the EPIC-pn. Beside the small flares visible from all the instruments, the EPIC-MOS showed an intriguing drop of the source count-rate ~3 ks after the beginning of the observation. We performed a spectral analysis of the combined MOS1 and MOS2 data extracted during this event6, but the relatively low statistics did not permit to carry out any detailed spectral analysis (only 60 counts were recorded during the ~0.7 ks corresponding to the event). The derived spectral parameters were fully consistent with those measured from the average spectrum, in turns compatible (to within the errors) with those already obtained from the spectral fit to the EPIC-pn data. The highest and lowest unabsorbed fluxes of IGR J16328−4726 recorded by the EPIC cameras were 5.2 × 10⁻¹¹ erg/cm2/s and 6.4 × 10⁻¹² erg/cm2/s, respectively. No significant evidence for coherent modulations was found in the EPIC data of the source.
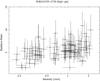 |
Fig. 6 Hardness-intensity diagram of IGR J16328−4726 realized by using EPIC-pn data. For this plot, data were rebinned in order to obtain in each bin a S/N ≳ 5. |
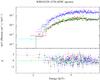 |
Fig. 7 EPIC-pn and EPIC-MOS spectra of IGR J16328−4726. The higher three spectra were extracted by selecting only the time intervals in which the EPIC-pn source count-rate was >1.5 cts/s (0.5–12 keV, see Fig. 4). The lower three spectra were extracted during time intervals in which the count-rate was <0.7 cts/s (same energy band). GTIs from the EPIC-pn were used also to extract the corresponding EPIC-MOS spectra. The best-fit model (solid line; |
3.4. SAX J1818.6−1703
The XMM-Newton observation of SAX J1818.6−1703 reported here was performed on 2010 March 21 starting from 12:20 UTC for a total exposure time of 45 ks. The EPIC-pn camera was operated in Full Frame mode, while the EPIC-MOS1 and EPIC-MOS2 were operated in Small Window and Fast Uncompressed mode, respectively. The source was not detected by the EPIC cameras. To estimate an upper limit on the source X-ray flux, we first filtered the EPIC data for the high flaring background and then applied the same technique as described in Sect. 3.2. As the observation suffered from a very high level of flaring background, the effective exposure time available for the EPIC-pn was 4.0 ks. We estimated from these data a 3σ upper limit on the source X-ray count-rate of 0.0052 cts/s, and converted this value into a 0.5–10 keV unabsorbed flux of 3.0 × 10⁻¹³ erg/cm2/s by assuming the same spectral model used in Bozzo et al. (2008b). This allows an easier comparison with the previous XMM-Newton non-detection of the source (see Sect. 2.4). We also checked that a less conservative selection of GTIs for the EPIC-pn data would not affect significantly the derived upper limit on the X-ray flux of SAX J1818.6−1703.
According to the ephemeris given by Bird et al. (2009), the epochs of the present XMM-Newton observation of SAX J1818.6−1703 corresponds to phase 0.53 ± 0.18. Even though the associated uncertainty is rather large, this result suggests that the XMM-Newton observation took place around the system apastron. The upper limit on the flux is indeed comparable with that estimated by the previous non-detection of the source at phase 0.51 (Bozzo et al. 2008b).
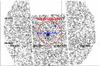 |
Fig. 8 XMM-Newton image of the FOV around IGR J17348−2045 (EPIC-MOS image in the 0.5–10 keV energy band). The two soft X-ray counterparts of IGR J17348−2045 detected within the INTEGRAL error circle of the source are indicated with blue circles. The radio object NVSS J173459−204533, spatially coincident with XMMU J173458.8−204530, is also indicated with a blue cross. |
3.5. IGR J17348−2045
IGR J17348−2045 was observed by XMM-Newton on 2011 March 2 for a total exposure time of 20 ks. The three EPIC detectors were operated in Full Frame with medium filter.
The observation was affected by a high flaring background, resulting in an effective exposure time of 10 ks for the two MOS cameras and 4 ks for pn. We searched simultaneously for the detected sources in all the cleaned EPIC images by using the edetect_chainSAS tool. Inside the INTEGRAL error circle around IGR J17348−2045 we found two soft X-ray sources located at RA = 17h34m58.80s, Dec = −20°45′30.96′′, and RA = 17h34m49.20s, Dec = −20°42′44.64′′, respectively. According to the XMM-Newton convention, we named the two sources XMMU J173458.8−204530 and XMMU J173449.2− 204244. The former source is clearly visible in all the images of the individual instruments and located close to the center of the INTEGRAL error-circle; the latter is detected only when all EPIC images are used simultaneously and located at the very rim of the INTEGRAL error circle (see Fig. 8). For this latter source no meaningful spectral information could be extracted, and we thus assume in the following that XMMU J173458.8−204530 is the true counterpart to IGR J17348−2045. For this source, the statistic was enough to perform a spectral analysis. We extracted the three MOS and pn spectra using a circular extraction region centered on the best determined source position (see above). The background spectrum was extracted from the closest source-free region to XMMU J173458.8−204530 (we checked that different choices of the background extraction region did not affect significantly the spectral results). On the EPIC-pn the source was located on the gap between two CCDs, and thus no spectrum could be extracted. A simultaneous fit to the EPIC-MOS spectra with an absorbed power-law model gave  cm-2,
cm-2,  (/d.o.f. = 0.7/16). The estimated absorption column density is much higher than the Galactic value expected in the direction of the source (~2 × 1021 cm-2; Dickey & Lockman 1990). The unabsorbed 2–10 keV flux is F2−10 keV = 2.2 × 10⁻¹² erg/cm2/s. No significant evidence for coherent modulations was found in the EPIC data of IGR J17348−2045. For this source we also retrieved the long-term ISGRI spectrum from the Heavens on-line tool (effective exposure time 3.9 Ms) and performed a combined fit with the MOS spectra (see Fig. 9). A normalization constant with respect to MOS was included in the fit to account for the inter-calibration between the instruments and possible variability of the source. The best fit model (/d.o.f. = 0.7/18) was obtained using the same absorbed power-law model as described above, with values of the absorption column density and power-law photon index fully compatible to within the uncertainties (no significant improvement on the uncertainties of the spectral parameters could be obtained). The normalization constant is
  , thus supporting the idea that the source is a persistent hard X-ray emitter (we verified that fixing the normalization constant to 1 for both the ISGRI and MOS spectra would not affect significantly the results of the fit). The estimated 20–40 keV and 40–100 keV X-ray fluxes were 2 × 10-12 erg/cm2/s and 5.2 × 10⁻¹² erg/cm2/s, respectively. These are compatible with the values reported by Bird et al. (2009).
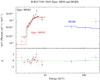 |
Fig. 9 EPIC-MOS and ISGRI spectra of XMMU J173458.8−204530, the most likely counterpart to IGR J17348−2045. The best fit is obtained by using an absorbed power-law model (see Sect. 3.5 for details). |
We also searched for counterparts to XMMU J173458.8−204530 in the optical, infrared and radio domain. The closest catalogued objects to the XMM source in the optical and infrared domains are USNO-B1.0 0692-0466331 (B1 = 15.82 mag, R1 = 12.97 mag, B2 = 15.40 mag, R2 = 14.35 mag, I = 11.70 mag) and 2MASS J17345863−2045292 (J = 10.532 mag, H = 9.446 mag, K = 9.019 mag), respectively. These two objects are located at the rim of the XMM-Newton error circle. In addition, the large absorption measured in the X-ray domain, which corresponds to an optical extinction of ≃ 8 mag according to Güver & Özel (2009), suggests that an optical counterpart might not be expected. Further observations are needed to confirm these associations (e.g. with Chandra). From the 1.4 GHz continuum NRAO Very Large Sky Survey (NVSS Condon et al. 1998), we also noticed that the object NVSS J173459−204533 lies relatively close to the XMM source (~4.8′′). The best determined position of the radio object is at RA = 17h34m59.08s ( ± 0.09 s), Dec = −20°45′33.8′′ ( ± 1.2 arcsec), and the integrated flux density at 1.4 GHz is 13.2 ± 0.6 mJy (Condon et al. 1998).
4. Discussion and conclusions
We reported here on the observations of five hard X-ray emitters obtained with XMM-Newton. Among these, four (IGR J08262−3736, IGR J17354−3255, IGR J16328−4726, SAX J1818.6−1703) are HMXBs, whereas IGR J17348−2045 is still unidentified.
4.1. IGR J08262−3736
The XMM-Newton observation of this source revealed a timing and spectral behaviour that are typical of classical SGXBs. The EPIC-pn lightcurve shows a relatively moderate variability on time scales of hundreds seconds with variations in the X-ray flux of a factor ~ 3–4. These variations are usually ascribed to changes in the mass accretion rate due to instabilities and density fluctuations in the supergiant wind (see Sect. 1). The EPIC spectra could not be fit with a simple absorbed power-law model, and clearly showed the presence of an excess in the residuals below 2–3 keV. The presence of this “soft excess”, requiring an additional spectral component to obtain an acceptable fit to the data, is believed to be a ubiquitous feature of binary systems hosting accreting NSs (Hickox et al. 2004). Its detectability is mostly related to the absorption column density in the direction of the source and its flux. In wind accreting binaries with X-ray luminosities comparable to that of IGR J08262−3736 ( ≃ 3 × 1034 erg s-1, assuming a distance of 6.1 kpc), the soft component is most likely originated by thermal X-ray photons close to the NS surface or by photoionized or collisionally heated diffuse gas in the binary system (Hickox et al. 2004).
The statistics of the EPIC spectra below 2–3 keV shown in Sect. 3.1 were unfortunately too low to clearly distinguish between these possibilities. An acceptable fit could be obtained by using either a hot (kT ≃ 1.2 keV) compact ( ≃ 0.1 km) BB component, or a colder (kT ≃ 0.1 keV) and more extended (~130 km) thermal emission. The latter model would probably be more plausible in the case of IGR J08262−3736 as low luminosity wind accreting systems are not expected to display hot emitting spots on the NS surface (see discussion in Bozzo et al. 2010, and references therein). As an alternative interpretation, we also showed in Table 1 that a partial-covering model would provide an acceptable description of the X-ray spectrum. In this case, the soft excess would be produced by the effect of partial obscuration of the emission from the NS by the surrounding high density material (see e.g., Tomsick et al. 2009b).
The combined fit of the EPIC spectra with that obtained from the long-term monitoring of the source with ISGRI, revealed that the models described above can also account for the higher energy emission recorded from the source (up to ~60 keV). The normalization constants between all the instruments were compatible with unity, thus suggesting that IGR J08262−3736 is characterized by a virtually constant persistent X-ray flux. This is expected for a classical SGXB.
4.2. IGR J17354−3255
The XMM-Newton observation detected only one of the two possible counterparts to the INTEGRAL source identified before with Swift and Chandra (see Sect. 3.2). For the most likely counterpart (S1), the non-detection by XMM-Newton sets a 3σ upper limit of 7 × 10-14 erg/cm2/s on its observed 0.5–10 keV X-ray flux. This is a factor of ~6 lower than the previously determined upper limit (see Sect. 3.2). This observation thus increases significantly the dynamic range in the X-ray luminosity of IGR J17354−3255, supporting the classification of this source as a SFXT.
We also note that the X-ray flux of the source S2 measured by XMM-Newton is roughly compatible with that reported previously by Vercellone et al. (2009), thus supporting the idea that this is a persistent object unrelated to the INTEGRAL source.
4.3. IGR J16328−4726
The XMM-Newton observation of this source revealed a variability on time scales of hundreds of seconds (see Fig. 4) that is very reminiscent of that observed from the SFXT prototypes IGR J17391−3021 and IGR J08408−4503 (Bozzo et al. 2010). This provides further support to the association of IGR J16328−4726 with this class of objects.
At odds with some other SFXTs observed in quiescence, we could not detect any soft excess in the X-ray spectrum of the source. According to the discussion in Sect. 4.1, this spectral component might have gone undetected in IGR J16328−4726 due to its relatively high absorption column density (NH ~ 1.8 × 1023 cm-2) and the lower exposure time with respect to the XMM-Newton observations of other quiescent SFXT sources with a similar X-ray luminosity (Bozzo et al. 2010).
As a final remark we note that the lowest X-ray flux measured by XMM-Newton is compatible with the upper limit reported previously with Swift /XRT by Fiocchi et al. (2010), thus suggesting that this is the real quiescent emission level of the source.
4.4. SAX J1818.6−1703
This source is one of the confirmed SFXTs, and has been observed in outburst several times with INTEGRAL and Swift. The properties of its soft X-ray emission ( ≲ 10 keV) during outbursts were investigated in detail thanks to the observations performed with the XRT on-board Swift, but so far no observations with a focusing X-ray telescope endowed with a high sensitivity was able to detect the source in quiescence. The XMM-Newton observation reported here and the one performed previously in 2006 (Bozzo et al. 2008b) were carried out close to the system apastron and provided a similar 3σ upper limit on the source X-ray luminosity of ≃ 2 × 1032 erg s-1 (assuming a distance of 2.5 kpc).
The nature of the prolonged quiescent state of SAX J1818.6−1703 around the apastron is presently unknown, due to the lack of proper spectral information. As the orbital period of the system is ~30 days, the presence of X-ray eclipses during apastron would imply relatively strong constraints on the system inclination. A high eccentricity (e) might help to reduce the accretion rate at the apastron, but the value of e inferred for SAX J1818.6−1703 (0.3–0.4) can hardly explain the large dynamic range in the X-ray luminosity displayed by the source (Bird et al. 2009; Zurita Heras & Chaty 2009). A further reduction of the mass accretion rate would thus require some additional mechanism to be at work at this orbital phase. Proposed models involve the inhibition of the accretion by the NS centrifugal and/or the magnetic barrier (Grebenev & Sunyaev 2007; Bozzo et al. 2008b), or the presence of a highly structured wind from the companion star which is extremely rarefied around apastron and permits at this phase only accretion at a very low-level (see, e.g. Zurita Heras & Chaty 2009, and references therein). Further observations of SAX J1818.6−1703 around orbital phase 0.4–0.6 with high sensitivity X-ray telescopes, like XMM-Newton and Chandra, are required to clarify the origin of the lowest X-ray luminosity state reached by this source.
4.5. IGR J17348−2045
This source was never observed before in the soft X-ray domain. The XMM-Newton data reported here allowed us to identify the counterpart to the INTEGRAL source and revealed that the source X-ray emission is intrinsically highly absorbed ( ≃ 1023 cm-2, see Sect. 3.5) and well described by a power-law model with Γ ~ 1.5. A simultaneous fit with the long-term ISGRI spectrum also supports the idea that the source is a persistent hard X-ray emitter.
The uncertainty in the EPIC-MOS position does not allow to firmly identify the counterparts at other wavelengths, but we remark here the possible association with the radio object NVSS J173459−204533. If this association will be confirmed by future observations performed with higher spatial-resolution instruments, we propose that IGR J17348−2045 could be a highly absorbed active Galactic nuclei (AGN). A number of these sources were recently discovered with INTEGRAL (see, e.g. Ricci et al. 2011, and references therein). Further multi-wavelength observations of this source are required in order to establish its real nature.
Conversions factors are 1 mCrab = 7.57 × 10⁻¹² erg/cm2/s in the 20−40 keV energy band and 1 mCrab = 9.42 × 10⁻¹² erg/cm2/s in the 40–100 keV energy band, respectively. The fluxes of the source thus correspond to 3.0( ± 0.8) × 10-12 erg/cm2/s and 7( ± 2) × 10-12 erg/cm2/s, respectively.
At the time of the XMM-Newton observation, the refined XRT position of IGR J08262−3736 (Malizia et al. 2011) was not available.
The source is relatively faint for the MOS1, and a position uncertainty as large as 4′′ can be expected in this case (see discussion in Pavan et al. 2011).
We performed this minimal grouping to avoid issues related to empty channels, see heasarc.nasa.gov/xanadu/xspec/XspecManual.pdf. A check was carried out a posteriori to verify that this did not affect the results.
Acknowledgments
E.B. thanks A. Tramacere and C. Ricci for useful discussions, and an anonymous referee for useful comments. The results presented in this paper are based on observations obtained with XMM-Newton, an ESA science mission with instruments and contributions directly funded by ESA Member States and NASA. This work also makes use of observations taken by INTEGRAL, an ESA project with instruments and science data centre funded by ESA member states (especially the PI countries: Denmark, France, Germany, Italy, Switzerland, Spain), Poland and with the participation of Russia and the USA.
References
- Bird, A. J., Malizia, A., Bazzano, A., et al. 2007, ApJS, 170, 175 [NASA ADS] [CrossRef] [Google Scholar]
- Bird, A. J., Bazzano, A., Hill, A. B., et al. 2009, MNRAS, 393, L11 [NASA ADS] [Google Scholar]
- Bird, A. J., Bazzano, A., Bassani, L., et al. 2010, ApJS, 186, 1 [NASA ADS] [CrossRef] [Google Scholar]
- Bozzo, E., Campana, S., Stella, L., et al. 2008a, The Astronomer’s Telegram, 1493 [Google Scholar]
- Bozzo, E., Falanga, M., & Stella, L. 2008b, ApJ, 683, 1031 [NASA ADS] [CrossRef] [Google Scholar]
- Bozzo, E., Stella, L., Israel, G., Falanga, M., & Campana, S. 2008c, MNRAS, 391, L108 [NASA ADS] [CrossRef] [Google Scholar]
- Bozzo, E., Stella, L., Ferrigno, C., et al. 2010, A&A, 519, A6 [NASA ADS] [CrossRef] [EDP Sciences] [Google Scholar]
- Bozzo, E., Giunta, A., Cusumano, G., et al. 2011, A&A, 531, A130 [NASA ADS] [CrossRef] [EDP Sciences] [Google Scholar]
- Bulgarelli, A., Gianotti, F., Trifoglio, M., et al. 2009, The Astronomer’s Telegram, 2017, 1 [Google Scholar]
- Cash, W. 1979, ApJ, 228, 939 [NASA ADS] [CrossRef] [Google Scholar]
- Condon, J. J., Cotton, W. D., Greisen, E. W., et al. 1998, AJ, 115, 1693 [NASA ADS] [CrossRef] [Google Scholar]
- Corbet, R. H. D., Barthelmy, S. D., Baumgartner, W. H., et al. 2010, The Astronomer’s Telegram, 2588 [Google Scholar]
- Cusumano, G., La Parola, V., Segreto, A., et al. 2010, A&A, 524, A64 [NASA ADS] [CrossRef] [EDP Sciences] [Google Scholar]
- D’Aì, A., La Parola, V., Cusumano, G., et al. 2011, A&A, 529, A30 [NASA ADS] [CrossRef] [EDP Sciences] [Google Scholar]
- Dickey, J. M., & Lockman, F. J. 1990, ARA&A, 28, 215 [NASA ADS] [CrossRef] [MathSciNet] [Google Scholar]
- Fiocchi, M., Sguera, V., Bazzano, A., et al. 2010, ApJ, 725, L68 [NASA ADS] [CrossRef] [Google Scholar]
- Grebenev, S. A., & Sunyaev, R. A. 2007, Astron. Lett., 33, 149 [NASA ADS] [CrossRef] [Google Scholar]
- Grupe, D., Kennea, J., Evans, P., et al. 2009, The Astronomer’s Telegram, 2075 [Google Scholar]
- Güver, T., & Özel, F. 2009, MNRAS, 400, 2050 [NASA ADS] [CrossRef] [Google Scholar]
- Hickox, R. C., Narayan, R., & Kallman, T. R. 2004, ApJ, 614, 881 [NASA ADS] [CrossRef] [Google Scholar]
- in ’t Zand, J. J. M. 2005, A&A, 441, L1 [NASA ADS] [CrossRef] [EDP Sciences] [Google Scholar]
- in ’t Zand, J., Heise, J., Smith, M., et al. 1998, IAU Circ., 6840, 2 [NASA ADS] [Google Scholar]
- in ’t Zand, J., Jonker, P., Mendez, M., & Markwardt, C. 2006, The Astronomer’s Telegram, 915 [Google Scholar]
- Kalberla, P. M. W., Burton, W. B., Hartmann, D., et al. 2005, A&A, 440, 775 [NASA ADS] [CrossRef] [EDP Sciences] [Google Scholar]
- Kreykenbohm, I., Wilms, J., Kretschmar, P., et al. 2008, A&A, 492, 511 [NASA ADS] [CrossRef] [EDP Sciences] [Google Scholar]
- Kuulkers, E., Shaw, S., Paizis, A., et al. 2006, The Astronomer’s Telegram, 874 [Google Scholar]
- Malizia, A., Landi, R., Bassani, L., et al. 2011, The Astronomer’s Telegram, 3294 [Google Scholar]
- Masetti, N., Parisi, P., Palazzi, E., et al. 2010, A&A, 519, A96 [NASA ADS] [CrossRef] [EDP Sciences] [Google Scholar]
- Negueruela, I. 2010, in High Energy Phenomena in Massive Stars, eds. J. Martí, P. L. Luque-Escamilla, & J. A. Combi, ASP Conf. Ser., 422, 57 [Google Scholar]
- Negueruela, I., Smith, D. M., Reig, P., Chaty, S., & Torrejón, J. M. 2006, in The X-ray Universe 2005, ed. A. Wilson, ESA Spec. Publ., 604, 165 [Google Scholar]
- Pavan, L., Bozzo, E., Ferrigno, C., et al. 2011, A&A, 526, A122 [NASA ADS] [CrossRef] [EDP Sciences] [Google Scholar]
- Reig, P. 2011, Ap&SS, 332, 1 [NASA ADS] [CrossRef] [Google Scholar]
- Ricci, C., Walter, R., Courvoisier, T. J.-L., & Paltani, S. 2011, A&A, 532, A102 [NASA ADS] [CrossRef] [EDP Sciences] [Google Scholar]
- Romano, P., La Parola, V., Vercellone, S., et al. 2011, MNRAS, 410, 1825 [NASA ADS] [Google Scholar]
- Sguera, V., Bazzano, A., Bird, A. J., et al. 2006, ApJ, 646, 452 [NASA ADS] [CrossRef] [Google Scholar]
- Sguera, V., Drave, S. P., Bird, A. J., et al. 2011, MNRAS, 417, 573 [NASA ADS] [CrossRef] [Google Scholar]
- Sidoli, L., Romano, P., Esposito, P., et al. 2009, MNRAS, 400, 258 [NASA ADS] [CrossRef] [Google Scholar]
- Smith, D. M., Main, D., Marshall, F., et al. 1998, ApJ, 501, L181 [NASA ADS] [CrossRef] [Google Scholar]
- Stella, L., White, N. E., & Rosner, R. 1986, ApJ, 308, 669 [NASA ADS] [CrossRef] [Google Scholar]
- Tomsick, J. A., Chaty, S., Rodriguez, J., Walter, R., & Kaaret, P. 2009a, ApJ, 701, 811 [NASA ADS] [CrossRef] [Google Scholar]
- Tomsick, J. A., Chaty, S., Rodriguez, J., et al. 2009b, ApJ, 694, 344 [NASA ADS] [CrossRef] [Google Scholar]
- Torrejón, J. M., Negueruela, I., Smith, D. M., & Harrison, T. E. 2010, A&A, 510, A61 [NASA ADS] [CrossRef] [EDP Sciences] [Google Scholar]
- Vercellone, S., D’Ammando, F., Striani, E., et al. 2009, The Astronomer’s Telegram, 2019 [Google Scholar]
- Walter, R., & Zurita Heras, J. 2007, A&A, 476, 335 [Google Scholar]
- Yamauchi, S., Aoki, T., Hayashida, K., et al. 1995, PASJ, 47, 189 [NASA ADS] [Google Scholar]
- Zurita Heras, J. A., & Chaty, S. 2009, A&A, 493, L1 [NASA ADS] [CrossRef] [EDP Sciences] [Google Scholar]
All Tables
All Figures
|
Fig. 1 XMM-Newton background-subtracted lightcurve of IGR J08262−3736 in two energy bands and the corresponding hardness ratio. The latter is calculated as the ratio between the source count rate in the 2–12 keV and 0.5–2 keV energy bands. The time bin is 150 s. |
| In the text | |
|
Fig. 2 Hardness-intensity diagram of IGR J08262−3736 obtained by using EPIC-pn data. For this plot, data were rebinned in order to have S/N ≳ 5 in each bin. |
| In the text | |
|
Fig. 3 Average XMM-Newton /EPIC and INTEGRAL /ISGRI spectra of IGR J08262−3736. The best-fit model (solid line) is obtained with a partial-covering power-law model. The residuals from the fit are shown in the bottom panel. |
| In the text | |
|
Fig. 4 XMM-Newton background-subtracted lightcurve of IGR J16328−4726. Data are shown in the 0.5–12 keV and 0.5−10 keV energy range for the EPIC-pn and EPIC-MOS, respectively. The time bin in all cases is 100 s. |
| In the text | |
|
Fig. 5 Average XMM-Newton spectrum of IGR J16328−4726 extracted from the EPIC-pn data. The best-fit model is obtained with an absorbed power law (see text for details). The residuals from the fit are shown in the bottom panel. |
| In the text | |
|
Fig. 6 Hardness-intensity diagram of IGR J16328−4726 realized by using EPIC-pn data. For this plot, data were rebinned in order to obtain in each bin a S/N ≳ 5. |
| In the text | |
|
Fig. 7 EPIC-pn and EPIC-MOS spectra of IGR J16328−4726. The higher three spectra were extracted by selecting only the time intervals in which the EPIC-pn source count-rate was >1.5 cts/s (0.5–12 keV, see Fig. 4). The lower three spectra were extracted during time intervals in which the count-rate was <0.7 cts/s (same energy band). GTIs from the EPIC-pn were used also to extract the corresponding EPIC-MOS spectra. The best-fit model (solid line; |
| In the text | |
|
Fig. 8 XMM-Newton image of the FOV around IGR J17348−2045 (EPIC-MOS image in the 0.5–10 keV energy band). The two soft X-ray counterparts of IGR J17348−2045 detected within the INTEGRAL error circle of the source are indicated with blue circles. The radio object NVSS J173459−204533, spatially coincident with XMMU J173458.8−204530, is also indicated with a blue cross. |
| In the text | |
|
Fig. 9 EPIC-MOS and ISGRI spectra of XMMU J173458.8−204530, the most likely counterpart to IGR J17348−2045. The best fit is obtained by using an absorbed power-law model (see Sect. 3.5 for details). |
| In the text | |
Current usage metrics show cumulative count of Article Views (full-text article views including HTML views, PDF and ePub downloads, according to the available data) and Abstracts Views on Vision4Press platform.
Data correspond to usage on the plateform after 2015. The current usage metrics is available 48-96 hours after online publication and is updated daily on week days.
Initial download of the metrics may take a while.