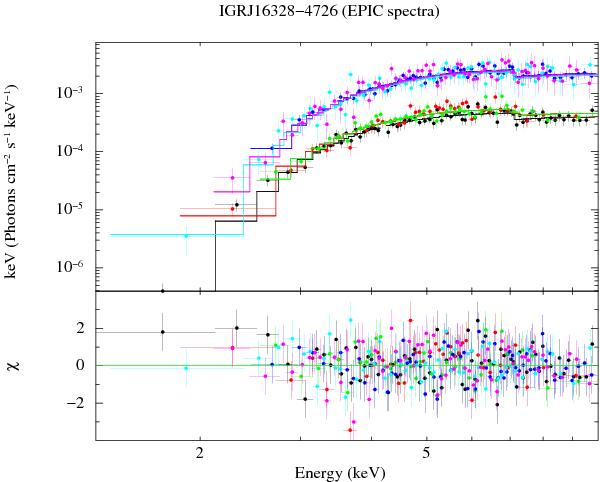
Fig. 7

EPIC-pn and EPIC-MOS spectra of IGR J16328−4726. The higher three spectra were extracted by selecting only the time intervals in which the EPIC-pn source count-rate was >1.5 cts/s (0.5–12 keV, see Fig. 4). The lower three spectra were extracted during time intervals in which the count-rate was <0.7 cts/s (same energy band). GTIs from the EPIC-pn were used also to extract the corresponding EPIC-MOS spectra. The best-fit model (solid line;  /d.o.f. = 0.9/332) is obtained with an absorbed power-law (the residuals from the fit are shown in the bottom panel). We obtained for the highest spectra NH = (17.4 ± 1.7) × 1022 cm-2 and Γ = 1.6 ± 0.2; for the lower spectra we obtained NH = (18.2 ± 1.8) × 1022 cm-2 and Γ = 1.5 ± 0.2. The corresponding observed 2–10 keV X-ray fluxes were 2.2 × 10⁻¹¹ erg/cm2/s and 4 × 10-12 erg/cm2/s, respectively.
Current usage metrics show cumulative count of Article Views (full-text article views including HTML views, PDF and ePub downloads, according to the available data) and Abstracts Views on Vision4Press platform.
Data correspond to usage on the plateform after 2015. The current usage metrics is available 48-96 hours after online publication and is updated daily on week days.
Initial download of the metrics may take a while.


