Free Access
Fig. 3
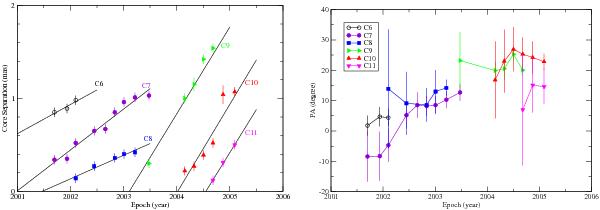
Core separation (left) and PA (right) of jet components plotted as a function of time at 22 GHz. The solid lines represent linear fits (left, see Table 3). C5 is not shown to obtain a clear plot for the inner jet components.
This figure is made of several images, please see below:
Current usage metrics show cumulative count of Article Views (full-text article views including HTML views, PDF and ePub downloads, according to the available data) and Abstracts Views on Vision4Press platform.
Data correspond to usage on the plateform after 2015. The current usage metrics is available 48-96 hours after online publication and is updated daily on week days.
Initial download of the metrics may take a while.