Fig. 1
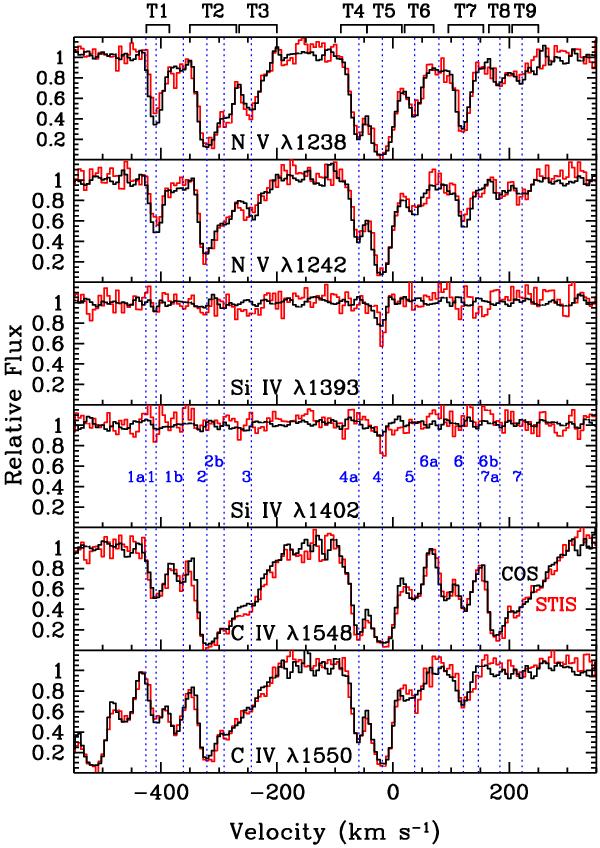
Comparison of spectral features in the COS (black) and STIS (red) spectra of Mrk 509. Normalized relative fluxes are plotted as a function of velocity relative to the systemic redshift of z = 0.034397. The boundaries of the 9 absorption troughs used in our analysis are shown along the top (see Table 1). The centroids of the individual Gaussian components identified in Paper VI are shown by the vertical dotted blue lines.
Current usage metrics show cumulative count of Article Views (full-text article views including HTML views, PDF and ePub downloads, according to the available data) and Abstracts Views on Vision4Press platform.
Data correspond to usage on the plateform after 2015. The current usage metrics is available 48-96 hours after online publication and is updated daily on week days.
Initial download of the metrics may take a while.