| Issue |
A&A
Volume 544, August 2012
|
|
|---|---|---|
| Article Number | A113 | |
| Number of page(s) | 7 | |
| Section | Extragalactic astronomy | |
| DOI | https://doi.org/10.1051/0004-6361/201118436 | |
| Published online | 08 August 2012 | |
NGC 3627: a galaxy-dwarf collision?⋆
1 Astronomisches Institut der Ruhr-Universität Bochum, Universitätsstrasse 150, 44780 Bochum, Germany
e-mail: This email address is being protected from spambots. You need JavaScript enabled to view it.
2 Obserwatorium Astronomiczne Uniwersytetu Jagiellońskiego, ul. Orla 171, 30-244 Kraków, Poland
Received: 10 November 2011
Accepted: 26 June 2012
Abstract
Context. Group galaxies very often show distinct signs of interaction with both companion galaxies and the intragroup medium. X-ray observations are particularly helpful because they provide information on the temperatures and the densities of the hot gas in galaxies and intergalactic space. This can put important constraints on the nature and timescales of these interactions.
Aims. We use the XMM-Newton X-ray observations of NGC 3627 in the Leo Triplet galaxy group to explain peculiar features visible in the polarized radio maps.
Methods. We analyzed soft X-ray (0.2−1 keV) emission from NGC 3627 to study the distribution of the hot gas and its temperature in different areas of the galaxy. Any change throughout the disk can reflect distortions visible in the radio polarized emission. We also studied two bright point sources that are probably tightly linked to the evolution of the galaxy.
Results. We find an increase in the temperature of the hot gas in the area of the polarized radio ridge in the western arm of the galaxy. In the eastern part of the disk we find two ultra-luminous X-ray sources. We note a large hot gas temperature difference (by a factor of 2) between the two bar ends.
Conclusions. The polarized radio ridge in the western arm of NGC 3627 is most likely formed by ram-pressure effects caused by the movement of the galaxy through the intragroup medium. To explain the distortions visible in the eastern part of the disk in polarized radio maps, the asymmetry of the bar, and the distortion of the eastern arm, we propose a recent collision of NGC 3627 with a dwarf companion galaxy.
Key words: galaxies: groups: general / galaxies: groups: individual: Leo Triplet / galaxies: individual: NGC 3627
Based on observations obtained with XMM-Newton, an ESA science mission with instruments and contributions directly funded by ESA Member States and NASA.
© ESO, 2012
1. Introduction
NGC 3627 (M66) is a barred galaxy of SAb type at a distance of 11 Mpc (see Table 1) in the Leo Triplet galaxy group. The dynamical model of Rots (1978) that assumes a relatively recent tidal interaction with another galaxy of the Leo Triplet, NGC 3628, is widely accepted to describe interactions of the galaxies within this group of galaxies (e.g. Haynes et al. 1979). The proposed model of interaction of NGC 3627 with NGC 3628 agrees with the radio continuum emission properties studied by Soida et al. (2001): they found characteristic signatures of an interaction, such as a steep gradient of the total power emission on one (western) side of the galaxy, and a much flatter gradient on the opposite (eastern) side. A very bright polarized radio emission ridge detected on the western side resembles the compression of the interstellar medium (ISM) caused by the interaction. In addition to these well-understood signs of interaction, Soida et al. (2001) discovered the so far unique polarized intensity (magnetic) arm, which ignores the underlying optical spiral arm structure and crosses it at a large angle. This unusual feature still remains unexplained.
NGC 3627 has been studied in a wide range of spectroscopic observations – in H i line emission (Zhang et al. 1993), CO (e.g. Paladino et al. 2008; Dumke et al. 2011), H α (Chemin et al. 2003). All authors reported a higher velocity dispersion measured in the vicinity of the southern bar end with respect to the northern one. High spectral resolution observations (in CO lines) showed a double line structure close to the southern bar end, at the part of NGC 3627 where the unusual magnetic arm was discovered. The most recent CO line analysis (Watanabe et al. 2011) reports no particular difference in the star formation rates at the two bar ends of NGC 3627.
To understand the differences in the ISM properties at the two bar ends we performed an analysis of the public archive X-ray data from XMM-Newton X-ray satellite observations. Those data have already been published, but the authors focused mainly on the AGN studies in galaxy samples (Galbiati et al. 2005; Corral et al. 2011; Brightman et al. 2011) or the construction of the XMM-Newton Slew Survey catalog (Saxton et al. 2008). We present here a thorough spatial and spectral analysis of the extended emission in the most distinct features of the galactic disk. Additionally, we used pipeline-processed archive observations from the Chandra X-ray Observatory to obtain accurate positions for selected point sources.
2. Observations and data reduction
Basic astronomical properties of NGC 3627.
Characteristics of the X-ray observations of NGC 3627.
We used archive observations of NGC 3627 performed by the XMM-Newton telescope on 26 May 2001. Although the observation is short, good cosmic weather allowed almost the entire data to be used for the analysis (see Table 2). The data were processed using the SAS 11.0 package (Gabriel et al. 2004) with standard reduction procedures. Following the routine of tasks epchain and emchain, event lists for two EPIC-MOS cameras (Turner et al. 2001) and the EPIC-pn camera (Strüder et al. 2001) were obtained. Next, the event lists were carefully filtered for bad CCD pixels and periods of intense radiation of high-energy background. The resulting lists were checked for the residual exsistence of soft proton flare contamination, which could influence the faint extended emission. To do that, we used a script1 that performs calculations developed by Molendi et al. (2004). We found that the event lists are only slightly contaminated, which should have no significant influence on the spectral analysis. This is also because we used not too sensitive archive data and expect that any slight influence of such contamination would be still within the errors of the derived parameters. The filtered event lists were used to produce images, background images, exposure maps (with and without vignetting correction), masked for an acceptable detector area using the images script2. All images and maps were produced (with exposure correction) in four bands of 0.2−1 keV, 1−2 keV, 2−4.5 keV, 4.5−12 keV. The images were then combined into final EPIC images and smoothed with a Gaussian filter to achieve a resolution of 15″ FWHM. To allow a better comparison with the radio maps and to increase the sensitivity for the low surface-brightness diffuse emission, we used another type of smoothing of the original count images. This time the images were smoothed adaptively with a maximum smoothing scale of 30″ FWHM. The rms values were obtained by averaging the emission over a large source-free area in the final map. Next, the spectral analysis was performed. For creating spectra only the event list from the EPIC-pn camera was used because it offers the highest sensitivity in the soft energy band. However, only the emission above 0.3 keV was analyzed because the internal noise of the pn camera is far below this limit3. Although not crucial when combined with MOS cameras to produce images, the exclusion of the softest emission below 0.3 keV is important to obtain reliable good quality spectra. Unsmoothed images for all bands were used to search for the background point sources using the standard SAS edetect_chain procedure. Regions found to include a possible point source were marked. The area was individually chosen by eye for each source, to ensure exclusion of all pixels brighter than the surrounding background. Those areas were then used for construction of spectral regions, for which spectra were acquired. Similarly, the spectra of the background were obtained using blank sky event lists (see Carter & Read 2007). These blank sky event lists were filtered using the same procedures as for the source event lists. For each spectrum response matrices and effective area files were produced. For the latter, detector maps needed for extended emission analysis were also created. The spectra were binned, which resulted in a better signal-to-noise ratio. To obtain a reasonable number of bins at the same time, we chose to have 25 total counts in one energy bin. Finally, the spectra were fitted using XSPEC 11 (Arnaud 1996). We also used the XMM-Newton Optical Monitor data acquired during the same observations and produced an image in the UVW1 filter using the standard SAS omchain procedure.
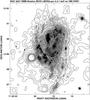 |
Fig. 1 Map of soft X-ray emission from NGC 3627 in the 0.2−1 keV band overlaid onto the XMM-Newton Optical Monitor UVW1 filter image. The contours are 3, 5, 8, 16, 25, 40, 60, 80, 100, 120, 150 × rms. The map is convolved to the resolution of 15″. The smoothing scale is shown in the bottom left corner of the figure. |
3. Results
3.1. Distribution of the X-ray emission
The 15′′ resolution image of NGC 3627 (Fig. 1) shows the hot gas emission following the optical disk of the galaxy. Howewer, in the lower part of the disk, an extension to the east is clearly visible. Within this extension, a bright point source can be seen, possibly an ultra-luminous X-ray source (ULX). The most interesting region, however, is the point-like source within the eastern arm, close to the southern end of the galactic bar. We present its spectral analysis and discuss its nature in Sect. 3.2. We detected no X-ray emitting ridge in the western arm of the galaxy, where a polarized radio ridge, hence the more regular magnetic field, is visible.
The adaptively smoothed image of NGC 3627 (Fig. 2) makes the faint emission clearly visible in the galactic outskirts. We see that a low surface-brightness envelope exists around the galaxy. Unfortunately, the archive data are not sensitive enough to determine via spectral analysis whether this emission comes from the hot galactic halo or the intergalactic medium (IGM). However, a slight asymmetry of the hot gas within the optical disk of the galaxy (Fig. 3) may give only a hint that the latter case may be observed, because the asymmetry would then be caused by the ram-pressure interaction, which most likely is happening (see Sect. 4.1). We can trace the extension to the east along Dec2000 = +12°59′, which corresponds well to the eastern magnetic arm of the galaxy.
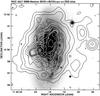 |
Fig. 2 Map of soft X-ray emission from NGC 3627 in the 0.2 − 1 keV band overlaid onto the DSS blue image. The contours are 3, 5, 8, 16, 25, 40, 60, 80, 100, 200 × rms. The map is adaptively smoothed with the largest scale of 30″. |
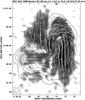 |
Fig. 3 Map of soft X-ray emission from NGC 3627 in the 0.2 − 1 keV band overlaid onto the VLA radio polarization map at 4.85 GHz from Soida et al. (2001). The contours are 16, 25, 40, 60, 80, 100, 150, 200, 500, 1000 × rms. The map is adaptively smoothed with the largest scale of 30″. The beam of the radio map is shown in the upper right corner of the figure. A magnetic field vector of a length of 1′ corresponds to radio polarized intensity of 0.25 mJy/b.a. The gray scale radio polarized map is cut at the 3σ level. |
3.2. Spectral analysis of the X-ray emission
To examine the properties of hot gas and possibly the history of the interactions of the galaxy with the environment, we performed a spectral analysis of the selected features within the galaxy. All regions related to those features are presented in Fig. 4. It includes the galactic nucleus (region C), the northern and southern end of the bar (regions N and S, resp.), a region corresponding to the radio polarized ridge in the western part of the galaxy (region W) and two point sources in the eastern part of the disk (regions ULX1 and ULX2). To determine of the average temperature of the hot gas in the disk of NGC 3627 we used the elliptical region (region R), which encompasses the entire X-ray emission from this galaxy, except for the regions mentioned above.
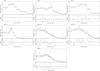
For spectra of the hot gas investigated by us (all regions except ULX1 and ULX2) we used a model attributing to a thermal plasma and a contribution from still unresolved point-like sources. Thermal plasma is represented in this work by a mekal model, which is a model of an emission spectrum from hot diffuse gas based on the model calculations of Mewe and Kaastra (Mewe et al. 1985; Kaastra 1992). In all models we fixed the metallicity to solar. A contribution from unresolved point-like sources is fitted with a simple power law. For the regions of ULX1 and ULX2 a power law model was used. Since the region ULX2 still lies within a spiral arm of the galaxy, an additional component accounting for the internal absorbtion was used. For all models we also used a fixed foreground (galactic) absorption (see Table 2). The errors provided for all model parameters (Table 3) are always 1-σ errors.
Both the central region and the southern end of the bar (regions C and S in Fig. 4) show a similar temperature of the hot gas (0.26 keV and 0.29
 keV, resp.), which corresponds to the temperature of the hot gas throughout the whole disk of NGC 3627 (0.29 ± 0.04 keV, region R in Fig. 4). A remarkable difference of a temperature of the hot gas can be seen in the northern end of the bar (region N). The gas is as hot as 0.71
 keV in this region. This is almost twice as high as in other parts of the galaxy, except for the region W, where a radio polarized ridge is visible. The hot gas in this region has a temperature of 0.51
 keV.
keV.
For the ULX1 and ULX2 sources we obtained photon indices of Γ = 1.62 ± 0.09 and  , respectively. The additional absorbtion in the model for the ULX2 source was fitted to be
  cm-2.
cm-2.
All plots of the modeled spectra together with fitted models are presented in Fig. 5. The obtained parameters are presented in Table 3 and the derived X-ray fluxes are shown in Table 4.
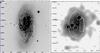 |
Fig. 4 Left: regions of NGC 3627 for which the spectra were aquired (see text for a detailed description) overlaid onto the DSS blue image. Right: the same regions as in the left panel overlaid onto the map of soft X-ray emission in the 0.2 − 1 keV band as shown in Fig. 1. |
Model-fit parameters of selected regions in NGC 3627.
Total (0.3−5 keV) and soft (0.3−1 keV) unabsorbed fluxes in 10-14 erg cm-2 s-1 for modeled regions in NGC 3627.
4. Discussion
Because NGC 3627 is believed to interact within the Leo Triplet galaxy group, we discuss results of the spectral analysis in terms of the influence of the group environment upon this galaxy. The hypothesis of a recent collision with a companion dwarf galaxy is also discussed.
4.1. Extended emission
The average temperature of the hot gas in the disk (region R) is 0.29 ± 0.04 keV, which corresponds to a typical temperature for the cool phase of the hot ISM in a spiral galaxy (e.g. Tüllmann et al. 2006; Owen & Warwick 2009). Similar temperatures can be found in the regions of the nucleus and the southern end of the galactic bar. However, a relatively low temperature for a bar end seems to be surprising. Usually, one expects a higher concentration of the H ii regions and strong gas compressions due to the mass flow between the bar and the spiral arm. In this case, the temperature of the hot gas should also be higher, as we see in the northern end of the bar. To investigate this in more detail, we calculated gas densities in those regions using the parameters obtained from the spectral analysis. To estimate the volumes of the regions, we assumed a disk thickness of 1 kpc. This can still introduce uncertainties in the volumes by a factor of 2 and vary the values of derived gas densities by 30 − 50%. For our derivation of densities we assumed fully ionized plasma (where ne ≃ nH). For the fit to the whole galactic disk we obtained a density of 5.7 × 10⁻³ × η-0.5 cm-3. The density of the hot gas for the northern and the southern end of the bar was found to be almost twice as high – 11.1 × 10⁻³ × η-0.5 cm-3 and 10.9 × 10⁻³ × η-0.5 cm-3, respectively. In the latter case, a temperature of 0.29 keV results in local pressure that is almost twice as high as in the galactic disk. For the northern part of the bar, however, a high temperature of the hot gas (0.71 keV) requires a significant rise (by a factor of ≃ 5) of the pressure above the level observed for the whole galaxy. For both cases this seems to be justified by a significant (in the southern end of the bar) and a very high (in the northern end of the bar) local star formation activity, as seen in the UV and Hα images (Figs. 1 and 6, respectively). However, UV and Hα regions in the area of the southern end of the bar seem somewhat “scattered” along the beginning of the eastern spiral arm, which may be caused by tidal interaction. Such an encounter would also explain the visible N-S asymmetry of the bar, as well as a large difference of the temperatures of the hot gas between the two ends of the bar. In Sect. 4.3 we present the hypothesis of a possible collision with a companion dwarf galaxy. The nuclear region yields the highest density of the hot gas (20.3 × 10⁻³ × η-0.5 cm-3), which could explain its low temperature (0.26 keV) by a more effective radiative cooling.
For the western arm (region W), where a polarized radio ridge is visible, we calculated a local hot gas density of 6 × 10⁻³ × η-0.5 cm-3, which is only slightly higher than the average value for the galactic disk. Although the temperature derived from the model fit to this region is consistent within errors with the average temperature of the galactic disk, this could be a hint of a local increase in the temperature of the hot gas, which might be attributed to the compression effects. Assuming this is the case, one can expect a local pressure increase by a factor of ≃ 1.8. This, together with a prominent dust lane well visible in optical images and lack of an enhanced star-forming activity in this region, suggests then the existence of local gas compresssions.
4.2. Point-like sources
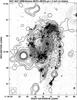 |
Fig. 6 Map of the X-ray emission from NGC 3627 in the 1 − 2 keV band overlaid onto the Hα image taken from the SINGS survey (Kennicutt et al. 2008). The contours are 3, 5, 8, 16, 25, 40, 60, 80, 100, 120, 150 × rms. The map is convolved to the resolution of 15″. The smoothing scale is shown in the bottom left corner of the figure. |
Positions and luminosities of the studied X-ray point sources in NGC 3627.
In the vicinity of the eastern spiral arm of NGC 3627, as mentioned in Sect. 3.1, two point-like sources are present. Those sources were also indentified by Swartz et al. (2011) as ULXes. The spectral fits presented in Sect. 3.2 allowed estimates of the luminosities of those sources (see Table 5). Comparing the fluxes (luminosities) of both sources we see that their values contradict their intensities, as observed in Fig. 1 – although source ULX2 is only ≃ 1.6 times less luminous, it appears to be significantly fainter in the contour map of the soft (0.2 − 1 keV) X-ray emission. This clearly shows that the emission from this source is absorbed in the eastern spiral arm of NGC 3627. Indeed, the fitted value of the internal absorption (8.7 cm-2) suggests that the softest X-ray emission is significantly diminished. A map in the higher energy band of 1 − 2 keV (Fig. 6) confirms this by showing both sources to be of comparable intensity. We used archive Chandra observations to verify the positions of both sources (see Table 5). For the ULX1 source we did not find any optical counterpart, which again confirms the nature of this source.
For the ULX2 source, however, we may see a candidate for an optically emitting star. The probable source has a clear counterpart in the HST ACS images of NGC 3627. After checking the HST astrometry against the UCAC-3 catalog (Zacharias et al. 2010), the bright, isolated source coincides with the coordinates from the Chandra Source Catalog Release 1.1 (Evans et al. 2010, see Table 5). This release of the catalog already incorporated the correction discussed by Rots & Budavari (2011). After correcting the HST images to the coordinate system of the UCAC-3 catalog, the bright, extended source is located at RA2000 = 11h20m18 33 Dec
 76. The Chandra position and the UCAC-3 reduced position on the HST ACS images agrees therefore within 0
 15. Since there is no other resolved source in a 15 square box on the HST ASC images, we judge a chance superposition highly unlikely.
The ULX2 source on the ACS images is clearly extended with a FWHM of 3.7 pix compared to the FWHM of several similarly bright stars near the source, which have a FWHM of 2.4 pix. The resulting PSF-corrected half-light radius of the source is therefore 7 pc, using a distance of 11 Mpc to NGC 3627. This size agrees perfectly with the typical size of young and old proto-globular star clusters in, e.g., M 33 and the Magellanic Clouds. Therefore, we can argue that the observed X-ray source may be a massive X-ray binary accreting at super-Eddington rate that resides within such a star cluster. We measured the total magnitude of the cluster in the F435W, F555W, and F814W and checked for excess emission in the F658W ACS frames. Following the recipes in the ACS section of the most recent HST data handbook and correcting for galactic forground extincting based on Schlegel et al. (1998), we derived total magnitudes for the cluster of B = 23.299 ± 0.008, V = 22.785 ± 0.008, I = 22.009 ± 0.008, resulting in B − V = 0.514 and V − I = 0.776 colors. After subtracting the scaled F555W image no residual Hα emission at the position of the cluster is visible on the F658N image, hinting at the absence or small number of emission line stars in the cluster and no surrounding H ii region. This may already hint at an age of the cluster in excess of 1 × 10⁷ years or that the cluster is massive enough that it has cleared the gas out of its environment. We can derive a more reliable age estimate, however, using the two measured colors of the cluster by comparing it to synthetic colors based on a STARBURST99 run using the most recent code version (Vázquez & Leitherer 2005). We assumed the STARBURST99 standard parameters and solar metallicity. As a result, we estimate the age of the cluster to be lower than 1.5 × 10⁷ yr and the internal extinction on this line of sight in NGC 3627 to be AV = 0.2 mag. Since the ULX2 source most likely resides within this cluster, we assume for this source the same age as for the cluster.
Since both sources presented above are bright, they most likely still contribute to the spectral fit for the R region. This is because the sizes of their regions were chosen by eye (see Sect. 2) to include only the apparently significant emission. This in turn was performed to avoid excluding of too much data from the fit to the galactic disk region (R). Bright unresolved sources from regions C and N could also contribute to the region R. To estimate this contribution we used the SAS task psfgen to construct the PSF for this specific observation using the calibration data, as performed by Bogdán & Gilfanov (2011). Next, using the actual sizes of our regions we calculated the energy fractions for all four sources. We found that the ULX1 source contributes with 7% of its energy to the spectrum of the region R (we note that less than half of its region is included in region R), while for the ULX2 source it is 13%. For the C and N regions the corresponding fractions are 40% and 14%, respectively. Using the fluxes for relevant regions (for regions N and R we used the fluxes of the power-law components) we calculated the total contribution from those sources to the spectrum of the region R to be 15.4 × 10⁻¹⁴ erg cm-2 s-1 and 4.6 × 10⁻¹⁴ erg cm-2 s-1 for the total and the soft flux respectively, which is 50% and 33% of the power-law component flux derived for the region R. Therefore, we conclude that a flux of 15.6 × 10⁻¹⁴ erg cm-2 s-1 still comes from unresolved point sources in the disk of NGC 3627.
4.3. Is a recent collision with a dwarf galaxy probable?
NGC 3627 shows clear marks of tidal and ram-pressure-induced distortions on the western and eastern sides of its disk. The western part of the disk is most likely ram-pressure-compressed, which suggests an extended polarized radio ridge and a local increase of the temperature of the hot gas (see Sect. 4.1). Furthermore, a slight asymmetry of the distribution of the hot gas, together with extensions of the hot gas to the east, along the magnetic arm (Fig. 3), can be a tracer of gas flows induced by the ram-pressure interaction. The asymmetry in the bar, together with the disturbance in the eastern arm and the southern end of the bar speaks for the gravitational origin of the disturbances of that area. The tidal interaction within the Leo Triplet seems to be obvious, but according to the model by Rots (1978), the main encounter took place some 800 Myr ago. The existence of massive binary systems (ULXes) may be caused by a local enhancement of the star formation, triggered by a tidal distortion. However, recent interaction with NGC 3628 does not fit this scenario, because the age of the ULX2 source is of the order of few tens of Myr only. To explain the observed features, a more recent event is needed.
The H i distribution (Zhang et al. 1993) shows an unusual kink in the eastern side close to the southern bar end. Heavily distorted radial velocity and enhanced velocity dispersion is seen in the vicinity of this bar end, also in other observations – in H i (Zhang et al. 1993), Hα (Chemin et al. 2003) and in CO (e.g. Reuter et al. 1996; Dumke et al. 2011). In the last case even a double line structure is clearly seen. The facts mentioned above fit the scenario of a recent collision with a dwarf galaxy. The galaxy could enter the disk rouhgly along the eastern magnetic arm (Fig. 3) and disturb the soutern end of the bar. This collision could induce locally enhanced star formation and explain the existence of massive binary systems there, as well as the distortions of the southern bar end and the eastern spiral arm. The admixture of colder dwarf matter can explain the lower thermal gas temperature around the southern bar end seen in X-rays.
A recent collision also agrees with the unusual magnetic field configuration in NGC 3627 (Soida et al. 2001). Magnetohydrodynamics models of galactic magnetic field evolution (e.g. Otmianowska & Vollmer 2003; Hanasz et al. 2009) show that a large-scale magnetic field needs hundreds of Myr to develop and adopt to the large-scale gas flow. Because the proposed collision took place a few tens of Myr ago only, the large-scale magnetic field still “remembers” the pre-collision gas flow.
In this scenario, a dwarf galaxy could enter the disk of NGC 3627 from above and roughly along its eastern magnetic arm. We probably see the debris of this dwarf (possibly its nucleus) as a distinct feature in the velocity field seen in CO line observations (Reuter et al. 1996; Dumke et al. 2011).
5. Summary and conclusions
We presented the analysis of the XMM-Newton X-ray data of NGC 3627 and conclude the following.
-
In the northern bar end we found much hotter gas than in thesouthern one, which confirms the optically visible asymmetry,possibly caused by a tidal interaction
-
An extended polarized radio ridge in the western arm of the galaxy is most likely caused by the ram-pressure effects within the Leo Triplet galaxy group, because we found signs for an increase in the temperature which, together with a gas density comparable to that of the disk, suggests compressions by the shock.
-
A slightly asymmetric distribution of the hot gas in the eastern part of the central galactic disk follows the magnetic arm.
-
To explain the observed features of NGC 3627 we propose a rapid movement of the galaxy through the IGM and a collision with a companion dwarf galaxy entering the disk from the southeastern direction some tens of Myr ago.
Acknowledgments
This work was supported by DLR Verbundforschung “Extraterrestrische Physik” at the Ruhr-University Bochum through grant 50 OR 0801. We thank Matthias Ehle, and the anonymous referee for valuable comments that helped to improve this paper.
References
- Arnaud, K. A. 1996, Astronomical Data Analysis Software and Systems V, eds. G. Jacoby, & J. Barnes, ASP Conf. Ser., 101, 17, [Google Scholar]
- Bogdán, Á., & Gilfanov, M. 2011, MNRAS, 418, 1901 [NASA ADS] [CrossRef] [Google Scholar]
- Brightman, M., & Nandra, K. 2011, MNRAS, 413, 1206 [CrossRef] [Google Scholar]
- Carter, J. A., & Read, A. M. 2007, A&A, 464, 1155 [NASA ADS] [CrossRef] [EDP Sciences] [Google Scholar]
- Chemin, L., Cayatte, V., Balkowski, C., et al. 2003, A&A, 405, 89 [NASA ADS] [CrossRef] [EDP Sciences] [Google Scholar]
- Corral, A., Della Ceca, R., Caccianiga, A., et al. 2011, A&A, 530, A42 [NASA ADS] [CrossRef] [EDP Sciences] [Google Scholar]
- Dumke, M., Krause, M., Beck, R., et al. 2011, ASPC, 446, 111 [NASA ADS] [Google Scholar]
- Evans, I. N., Primini, F. A., Glotfelty, K. J., et al. 2010, ApJS, 189, 37 [NASA ADS] [CrossRef] [EDP Sciences] [Google Scholar]
- Gabriel, C., Denby, M., Fyfe, D. J., et al. 2004, ASPC, 314, 759 [NASA ADS] [Google Scholar]
- Galbiati, E., Caccianiga, A., Maccacaro, T., et al. 2005, A&A, 430, 927 [NASA ADS] [CrossRef] [EDP Sciences] [Google Scholar]
- Gunn, J. E., & Gott, J. R. 1972, ApJ, 176, 1 [NASA ADS] [CrossRef] [Google Scholar]
- Hanasz, M., Otmianowska-Mazur, K., Kowal, G., & Lesch, H. 2004, A&A, 498, 335 [Google Scholar]
- Haynes, M. P., Giovanelli, R., & Roberts, M. S. 1979, ApJ, 229, 83 [NASA ADS] [CrossRef] [Google Scholar]
- Jansen, F., Lumb, D., Altieri, B., et al. 2001, A&A, 365, 1 [NASA ADS] [CrossRef] [EDP Sciences] [Google Scholar]
- Kaastra, J. S. 1992, An X-Ray Spectral Code for Optically Thin Plasmas (Internal SRON-Leiden Report, updated version 2.0) [Google Scholar]
- Kalberla, P. M. W., Burton, W. B., Hartmann, D., et al. 2005, A&A, 440, 775 [NASA ADS] [CrossRef] [EDP Sciences] [Google Scholar]
- Kanbur, S. M., Ngeow, C., Nikolaev, S., et al. 2003, A&A, 411, 361 [NASA ADS] [CrossRef] [EDP Sciences] [Google Scholar]
- Kennicutt, R. C., Lee, J. C., Funes, J. G., et al. 2008, ApJS, 178, 247 [NASA ADS] [CrossRef] [Google Scholar]
- Mewe, R., Gronenschild, E. H. B. M., & van den Oord, G. H. J. 1985, A&AS, 62, 197 [NASA ADS] [Google Scholar]
- Molendi, S., De Luca, A., & Leccardi, A. 2004, A&A, 419, 837 [NASA ADS] [CrossRef] [EDP Sciences] [Google Scholar]
- Otmianowska-Mazur, K., & Vollmer, B. 2003, A&A, 402, 879 [NASA ADS] [CrossRef] [EDP Sciences] [Google Scholar]
- Owen, R. A., & Warwick, R. S. 2009, MNRAS, 394, 1741 [NASA ADS] [CrossRef] [Google Scholar]
- Paladino, R., Murgia, M., Tarchi, A., et al. 2008, A&A, 485, 679 [NASA ADS] [CrossRef] [EDP Sciences] [Google Scholar]
- Paturel, G. 2003, A&A, 412, 45 [NASA ADS] [CrossRef] [EDP Sciences] [Google Scholar]
- Reuter, H.-P., Sievers, A. W., Pohl, M., et al. 1996, A&A, 306, 721 [NASA ADS] [Google Scholar]
- Rots, A. H. 1978, AJ, 83, 3 [Google Scholar]
- Rots, A. H., & Budavári, T. 2011, ApJS, 192, 8 [NASA ADS] [CrossRef] [Google Scholar]
- Saxton, R. D., Read, A. M., Esquej, P., et al. 2008, A&A, 480, 611 [NASA ADS] [CrossRef] [EDP Sciences] [Google Scholar]
- Soida, M., Urbanik, M., Beck, R., et al. 2001, A&A, 378, 40 [NASA ADS] [CrossRef] [EDP Sciences] [Google Scholar]
- Swartz, D. A., Soria, R., Tennant, A. F., & Yukita, M. 2011, ApJ, 741, 49 [NASA ADS] [CrossRef] [Google Scholar]
- Schlegel, D. J., Finkbeiner, D. P., & Davis, M. 1998, ApJ, 500, 525 [NASA ADS] [CrossRef] [Google Scholar]
- Strüder, L., Briel, U., Dennerl., K., et al. 2001, A&A, 365, 18 [Google Scholar]
- Toomre, A., & Toomre, J. 1972, ApJ, 178, 623 [NASA ADS] [CrossRef] [Google Scholar]
- Turner, M. J. L., Abbey, A., Arnaud, M., et al. 2001, A&A, 365, 27 [Google Scholar]
- Tüllmann, R., Pietch, W., Rossa, J., et al. 2006, A&A, 448, 43 [NASA ADS] [CrossRef] [EDP Sciences] [Google Scholar]
- Vázquez, G. A., & Leitherer, C. 2005, ApJ, 621, 695 [NASA ADS] [CrossRef] [Google Scholar]
- Watanabe, Y., Sorai, K., Kuno, N., & Habe, A. 2011, MNRAS, 411, 1409 [NASA ADS] [CrossRef] [Google Scholar]
- Zacharias, N., Finch, C., Girard, T., et al. 2010, AJ, 139, 2184 [NASA ADS] [CrossRef] [Google Scholar]
- Zhang, X., Wright, M., & Alexander, P. 1993, ApJ, 418, 100 [NASA ADS] [CrossRef] [Google Scholar]
All Tables
Total (0.3−5 keV) and soft (0.3−1 keV) unabsorbed fluxes in 10-14 erg cm-2 s-1 for modeled regions in NGC 3627.
All Figures
|
Fig. 1 Map of soft X-ray emission from NGC 3627 in the 0.2−1 keV band overlaid onto the XMM-Newton Optical Monitor UVW1 filter image. The contours are 3, 5, 8, 16, 25, 40, 60, 80, 100, 120, 150 × rms. The map is convolved to the resolution of 15″. The smoothing scale is shown in the bottom left corner of the figure. |
| In the text | |
|
Fig. 2 Map of soft X-ray emission from NGC 3627 in the 0.2 − 1 keV band overlaid onto the DSS blue image. The contours are 3, 5, 8, 16, 25, 40, 60, 80, 100, 200 × rms. The map is adaptively smoothed with the largest scale of 30″. |
| In the text | |
|
Fig. 3 Map of soft X-ray emission from NGC 3627 in the 0.2 − 1 keV band overlaid onto the VLA radio polarization map at 4.85 GHz from Soida et al. (2001). The contours are 16, 25, 40, 60, 80, 100, 150, 200, 500, 1000 × rms. The map is adaptively smoothed with the largest scale of 30″. The beam of the radio map is shown in the upper right corner of the figure. A magnetic field vector of a length of 1′ corresponds to radio polarized intensity of 0.25 mJy/b.a. The gray scale radio polarized map is cut at the 3σ level. |
| In the text | |
|
Fig. 4 Left: regions of NGC 3627 for which the spectra were aquired (see text for a detailed description) overlaid onto the DSS blue image. Right: the same regions as in the left panel overlaid onto the map of soft X-ray emission in the 0.2 − 1 keV band as shown in Fig. 1. |
| In the text | |
|
Fig. 6 Map of the X-ray emission from NGC 3627 in the 1 − 2 keV band overlaid onto the Hα image taken from the SINGS survey (Kennicutt et al. 2008). The contours are 3, 5, 8, 16, 25, 40, 60, 80, 100, 120, 150 × rms. The map is convolved to the resolution of 15″. The smoothing scale is shown in the bottom left corner of the figure. |
| In the text | |
Current usage metrics show cumulative count of Article Views (full-text article views including HTML views, PDF and ePub downloads, according to the available data) and Abstracts Views on Vision4Press platform.
Data correspond to usage on the plateform after 2015. The current usage metrics is available 48-96 hours after online publication and is updated daily on week days.
Initial download of the metrics may take a while.