Fig. 9
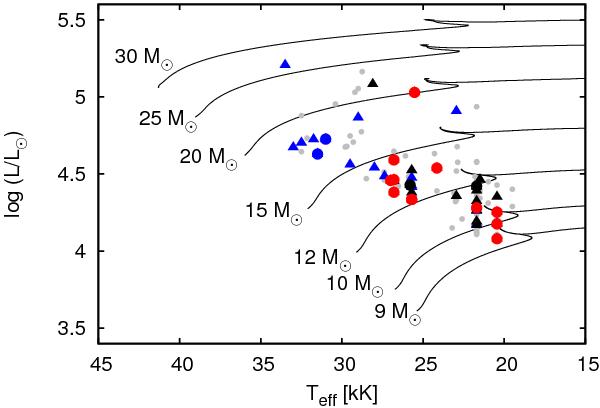
The Hertzsprung-Russel diagram is shown for several evolutionary models (LMC) with initial masses from 9 to 30 M⊙ and surface rotational velocities of approximately 200 km s-1. Additionally, our sample with LMC-metallicity is depicted. Stars of Class 1 are indicated by circles and stars of Class 2 are represented by triangles. With respect to Fig. 8, stars in Box 1 are shown in red, star in Box 3 in blue and stars in Box 5 in black. Grey dots depict the remaining not analyzed stars of the VLT-FLAMES Survey (LMC) after the selection criteria applied in Brott et al. (2011b).
Current usage metrics show cumulative count of Article Views (full-text article views including HTML views, PDF and ePub downloads, according to the available data) and Abstracts Views on Vision4Press platform.
Data correspond to usage on the plateform after 2015. The current usage metrics is available 48-96 hours after online publication and is updated daily on week days.
Initial download of the metrics may take a while.