Fig. 8
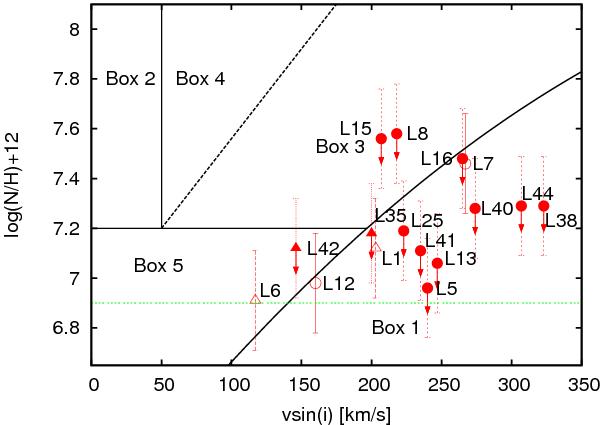
Hunter-diagram of all stars shown in Fig. 7. The surface nitrogen abundance is plotted as a function of the projected surface rotational velocity for stars located in the LMC. Upper limits to the surface nitrogen abundance are marked by filled symbols. In addition there is a differentiation between single stars (circles) and probable binaries (triangles). A subdivision into five boxes as defined in Brott et al. (2011b) has been done to simplify the analysis. The green dotted line represents the initial surface nitrogen abundance for LMC B stars.
Current usage metrics show cumulative count of Article Views (full-text article views including HTML views, PDF and ePub downloads, according to the available data) and Abstracts Views on Vision4Press platform.
Data correspond to usage on the plateform after 2015. The current usage metrics is available 48-96 hours after online publication and is updated daily on week days.
Initial download of the metrics may take a while.