Fig. 7
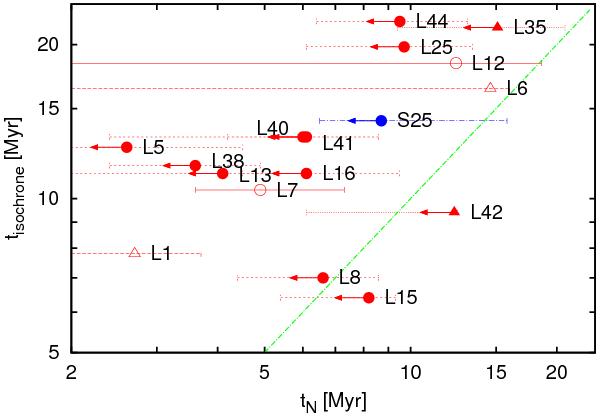
The upper age limits tN obtained from nitrogen chronology for Class 1 stars are plotted against the ages derived using isochrone fitting in the HR diagram, tisochrone. Stars located in the LMC are shown with red symbols while the SMC star is depicted in blue. Stars for which only upper limits to the surface nitrogen abundances could be determined are marked by filled symbols with arrows indicating the direction of change in the results when the surface nitrogen abundance is smaller then the value of the upper limit. Circles mark single stars and triangles indicate probable binaries. The green dotted line is defined by tN = tisochrone.
Current usage metrics show cumulative count of Article Views (full-text article views including HTML views, PDF and ePub downloads, according to the available data) and Abstracts Views on Vision4Press platform.
Data correspond to usage on the plateform after 2015. The current usage metrics is available 48-96 hours after online publication and is updated daily on week days.
Initial download of the metrics may take a while.