Fig. 4
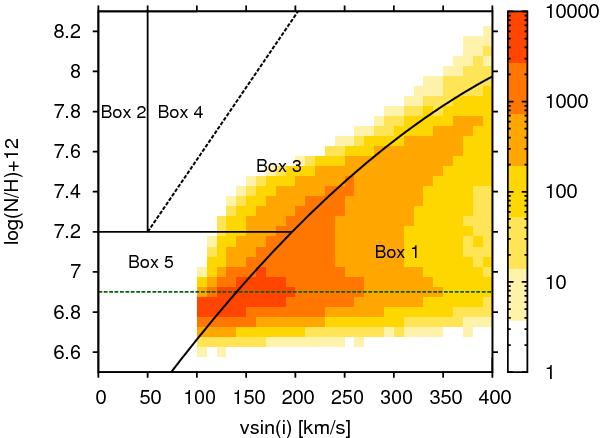
Hunter-diagram of Class 1 stars of a synthetic population of main sequence stars obtained using the STARMAKER code (Brott et al. 2011b). The surface nitrogen abundance is plotted versus the projected surface rotational velocity. The colors indicate the number of Class 1 stars in a given pixel. The absolute scaling is arbitrary. The Hunter-diagram is divided into 5 areas as in (Brott et al. 2011b) to simplify the later analysis.
Current usage metrics show cumulative count of Article Views (full-text article views including HTML views, PDF and ePub downloads, according to the available data) and Abstracts Views on Vision4Press platform.
Data correspond to usage on the plateform after 2015. The current usage metrics is available 48-96 hours after online publication and is updated daily on week days.
Initial download of the metrics may take a while.