Fig. A.3
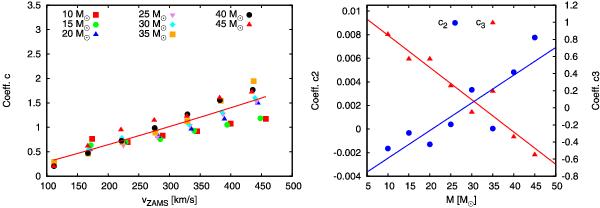
On the left panel, the parameter c is shown as a function of initial surface rotational velocity for several different masses. The line represents the best fit for the 30 M⊙ model. On the right panel, the coefficients c2(M) and c3(M) are plotted as functions of the initial mass. They can be reproduced best using linear functions shown by solid lines.
Current usage metrics show cumulative count of Article Views (full-text article views including HTML views, PDF and ePub downloads, according to the available data) and Abstracts Views on Vision4Press platform.
Data correspond to usage on the plateform after 2015. The current usage metrics is available 48-96 hours after online publication and is updated daily on week days.
Initial download of the metrics may take a while.