Fig. 5
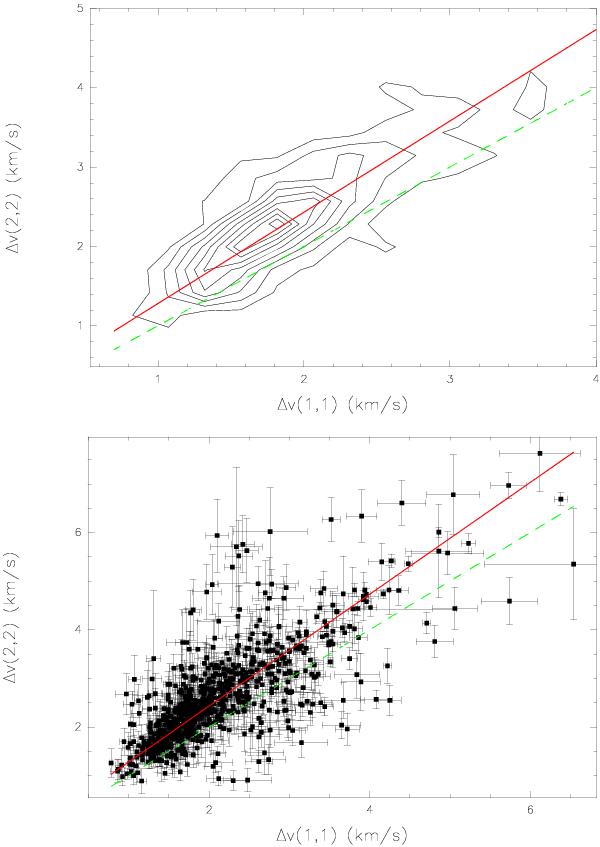
Correlation plot of the NH3 (1, 1) and (2, 2) linewidths. The straight green dashed line corresponds to equal widths, the red solid line includes the correction for the hyperfine structure of the (2, 2) line ΔvGauss(2, 2) = 1.15·ΔvHFS(2, 2) + 0.13. The (1, 1) and (2, 2) linewidths are mostly equally distributed around the red solid line, as shown by the contour plot in the top panel. For this upper plot we counted the number of sources in each (1, 1) and (2, 2) linewidth bin of 0.1 km s-1. The contours give 10 to 90% in steps of 10% of the peak source number per bin, these levels are used for all contour plots in this article.
Current usage metrics show cumulative count of Article Views (full-text article views including HTML views, PDF and ePub downloads, according to the available data) and Abstracts Views on Vision4Press platform.
Data correspond to usage on the plateform after 2015. The current usage metrics is available 48-96 hours after online publication and is updated daily on week days.
Initial download of the metrics may take a while.