Fig. 21
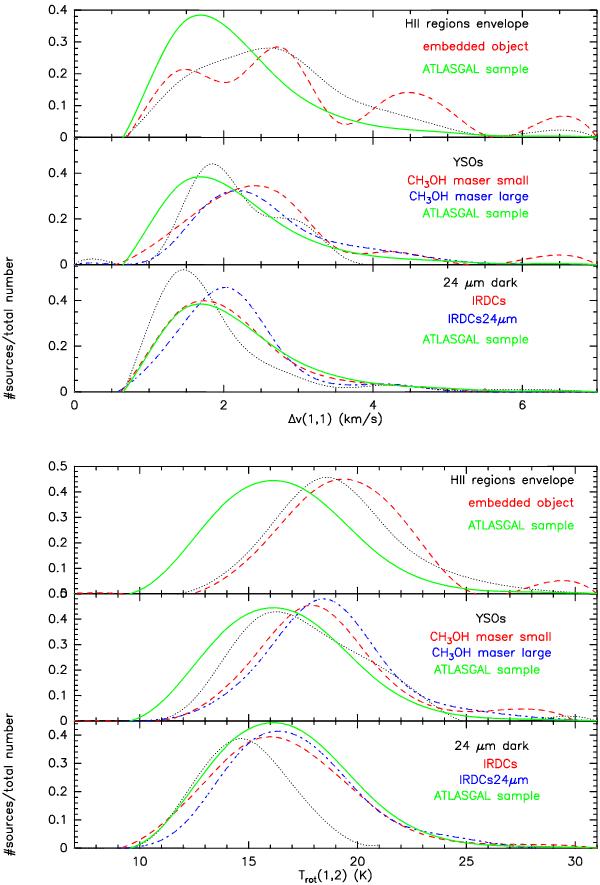
Relative number distribution of ATLASGAL subsamples in different evolutionary phases of high-mass star formation showing the NH3 (1, 1) linewidth in the upper part and the rotational temperature in the lower part. The whole ATLASGAL sample is shown as solid green curve in each panel, while the other subsamples are indicated by different patterns and colours: lower panel: dotted black curve: ATLASGAL clumps not detected at 24 μm, dashed red: IRDCs from Peretto & Fuller (2009), dashed-dotted blue: an IRDC subsample emitting at 24 μm; Middle panel: dotted black curve: young stellar objects (YSOs) from the rms survey (Hoare et al. 2005), dashed red: CH3OH masers from Pandian et al. (2011), Szymczak et al. (2002), and Caswell et al. (2010) found within a small search radius (see Sect. 7), dashed-dotted blue: same CH3OH maser samples found in a large radius (see Sect. 7); upper panel: UCHII regions from Hoare et al. (2005), dotted black curve: associations with the envelope in a large search radius (see Sect. 7), dashed red curve: associations with embedded object in a small search radius (see Sect. 7).
Current usage metrics show cumulative count of Article Views (full-text article views including HTML views, PDF and ePub downloads, according to the available data) and Abstracts Views on Vision4Press platform.
Data correspond to usage on the plateform after 2015. The current usage metrics is available 48-96 hours after online publication and is updated daily on week days.
Initial download of the metrics may take a while.