Fig. 18
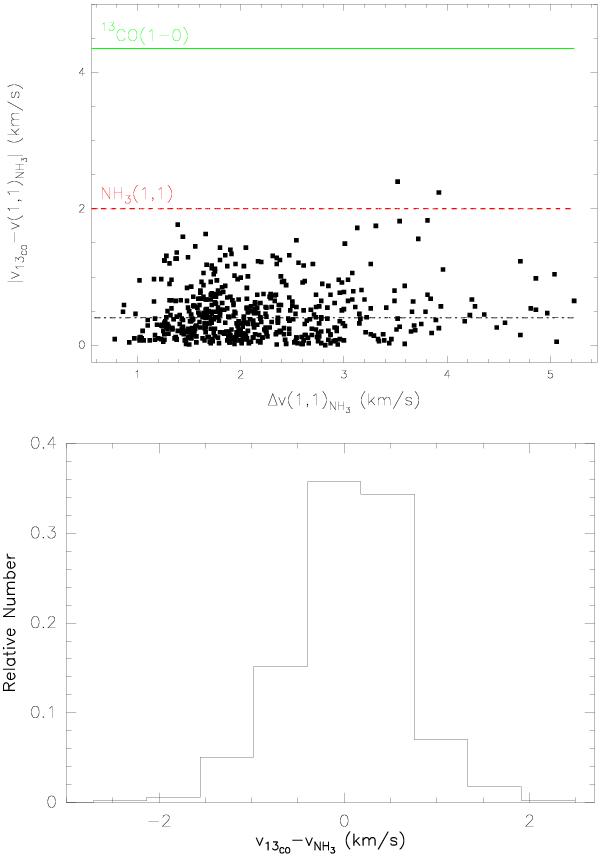
Absolute value of the difference in line-centre velocities of 13CO (1−0) and NH3 lines detected in the ATLASGAL sources plotted against the ammonia linewidth in the top panel. The differences of most clumps are similar to the typical NH3 linewidth, which is indicated by the dashed red line, and smaller than the width of the 13CO transition labelled by the solid green line, the rms of the absolute value of the difference in 13CO and NH3 (1, 1) velocities is shown by the dashed-dotted line. The bottom panel shows the relative number distribution of the ATLASGAL clumps with the velocity differences of both molecules. The 13CO and NH3 velocities of most sources differ by more than the sound speed at 0.23 km s-1.
Current usage metrics show cumulative count of Article Views (full-text article views including HTML views, PDF and ePub downloads, according to the available data) and Abstracts Views on Vision4Press platform.
Data correspond to usage on the plateform after 2015. The current usage metrics is available 48-96 hours after online publication and is updated daily on week days.
Initial download of the metrics may take a while.