Fig. 13
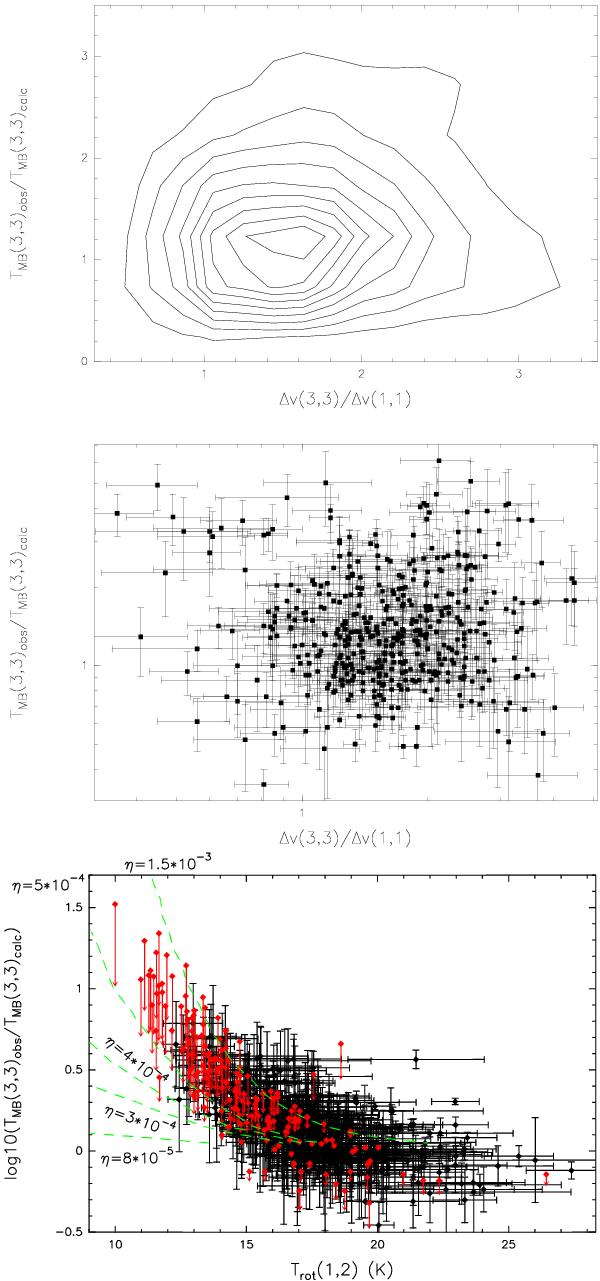
Ratio of observed to calculated (3, 3) main beam brightness temperatures compared to the ratio of the (3, 3) to (1, 1) linewidths as a contour plot in the top panel and as a scatter plot in the middle panel. The correlation plot of the rotational temperature and observed to calculated (3, 3) main beam brightness temperature ratio is displayed in the lowest panel. Red points show sources that are not detected in the NH3 (3, 3) line. Green dashed curves indicate very low hot core beam filling factors between 0.008% and 0.15%.
Current usage metrics show cumulative count of Article Views (full-text article views including HTML views, PDF and ePub downloads, according to the available data) and Abstracts Views on Vision4Press platform.
Data correspond to usage on the plateform after 2015. The current usage metrics is available 48-96 hours after online publication and is updated daily on week days.
Initial download of the metrics may take a while.