Free Access
Fig. 12
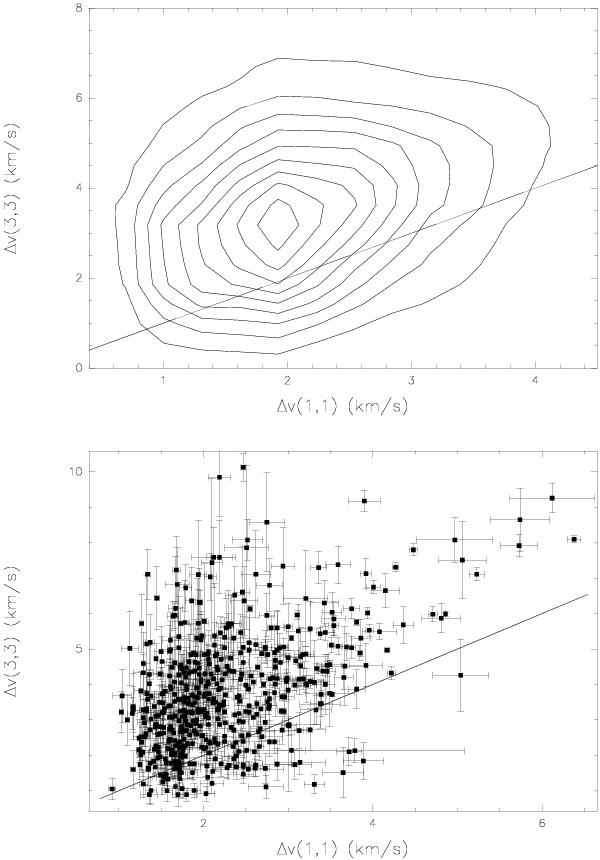
Width of the NH3 (3, 3) line plotted against that of the (1, 1) line. The straight line shows equal widths. The contour plot is displayed in the top panel with a binning of 0.7 km s-1 for the range of (1, 1) linewidths and of 1 km s-1 for that of (3, 3) linewidths.
This figure is made of several images, please see below:
Current usage metrics show cumulative count of Article Views (full-text article views including HTML views, PDF and ePub downloads, according to the available data) and Abstracts Views on Vision4Press platform.
Data correspond to usage on the plateform after 2015. The current usage metrics is available 48-96 hours after online publication and is updated daily on week days.
Initial download of the metrics may take a while.