Fig. 10
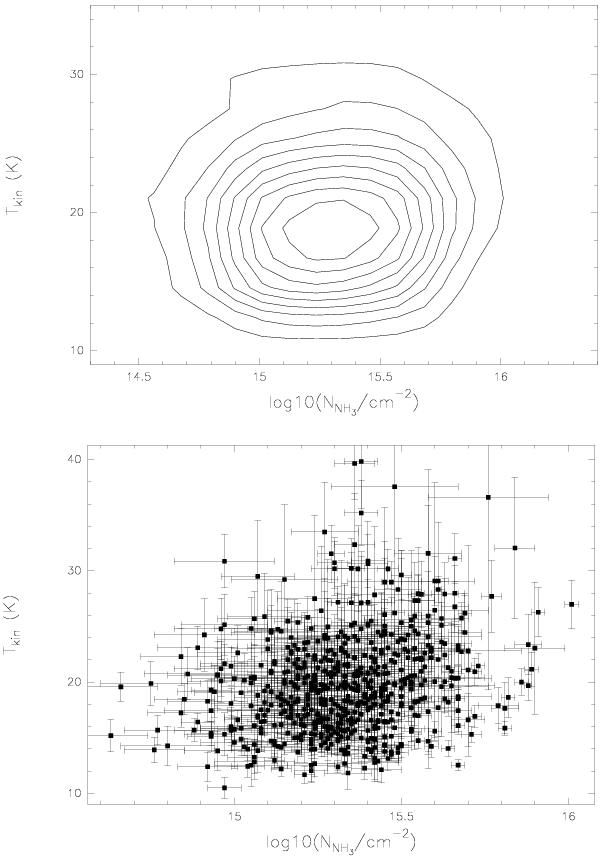
Logarithm of the column density compared with the kinetic temperature. There is no correlation between both. Contour lines of the NH3 parameters are shown in the upper plot. Bins of 0.4 cm-2 are used for the logarithm of the column density and bins of 2 K for the kinetic temperature.
Current usage metrics show cumulative count of Article Views (full-text article views including HTML views, PDF and ePub downloads, according to the available data) and Abstracts Views on Vision4Press platform.
Data correspond to usage on the plateform after 2015. The current usage metrics is available 48-96 hours after online publication and is updated daily on week days.
Initial download of the metrics may take a while.