Free Access
Fig. 1
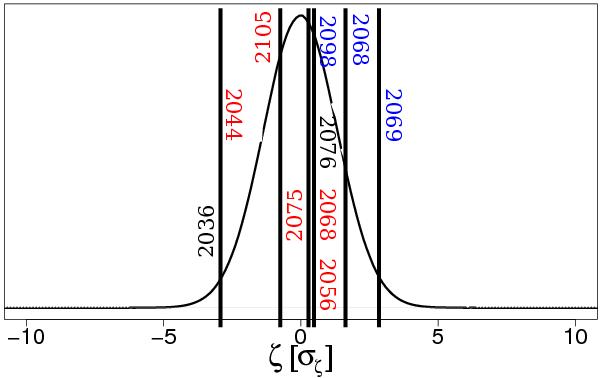
ζ distribution and position of primary (black color) and secondary keyholes leading to collision at ascending node (red color) and descending node (blue color). The distribution is centered on the nominal value ζN and the ζ-axis is expressed in σζ unit.
Current usage metrics show cumulative count of Article Views (full-text article views including HTML views, PDF and ePub downloads, according to the available data) and Abstracts Views on Vision4Press platform.
Data correspond to usage on the plateform after 2015. The current usage metrics is available 48-96 hours after online publication and is updated daily on week days.
Initial download of the metrics may take a while.