Fig. 8
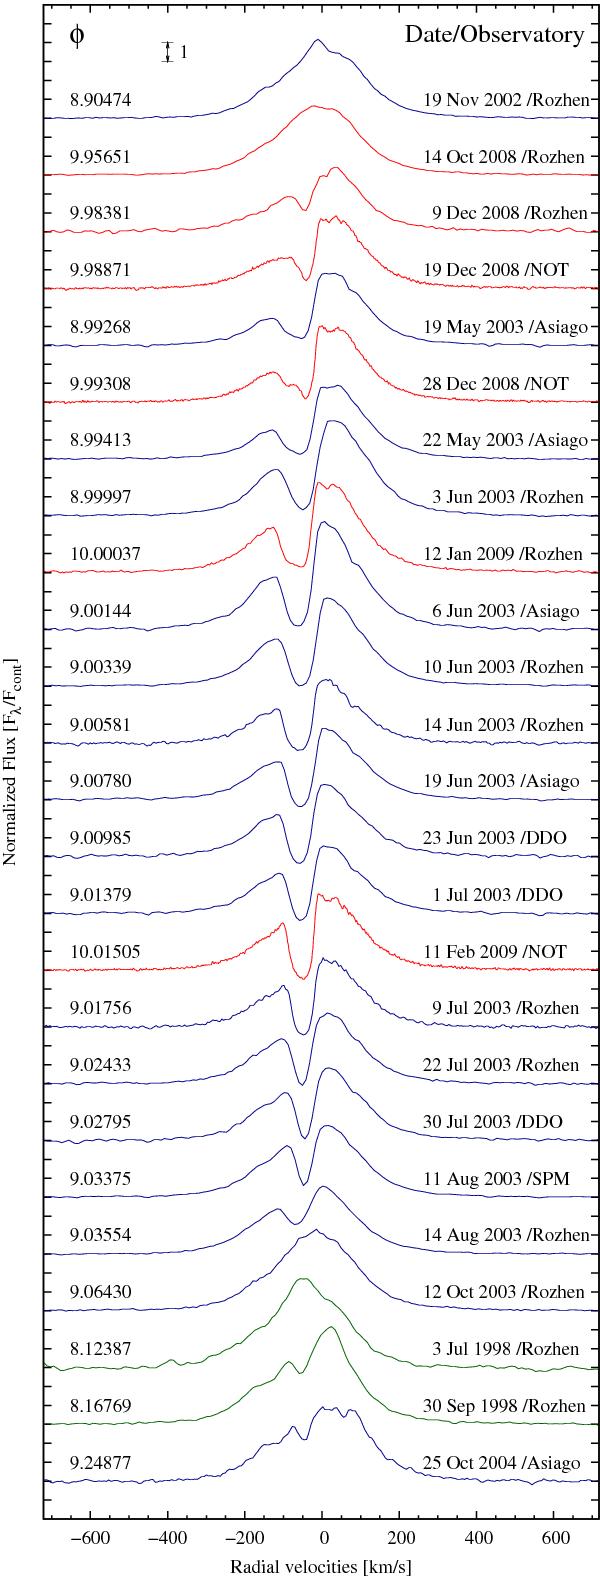
Representative examples of Hα line profiles in the spectra obtained near the eclipses at epochs E = 10, E = 9, and E = 8 (in the electronic version of this paper, the profiles have different colours: red, blue, and green, respectively). The spectra are vertically offset for clarity.
Current usage metrics show cumulative count of Article Views (full-text article views including HTML views, PDF and ePub downloads, according to the available data) and Abstracts Views on Vision4Press platform.
Data correspond to usage on the plateform after 2015. The current usage metrics is available 48-96 hours after online publication and is updated daily on week days.
Initial download of the metrics may take a while.