Fig. 7
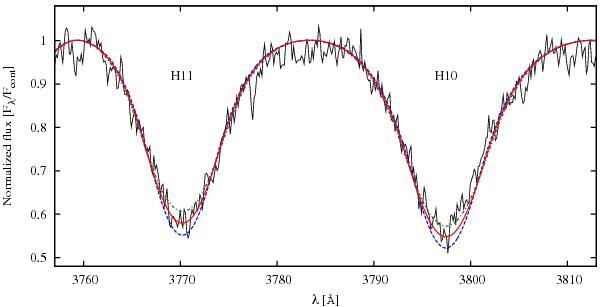
Balmer H10 and H11 line profiles in the spectrum of EE Cep taken on 11 Aug. 2003 with an Echelle spectrograph on the 2.12 m telescope in SPM Observatory in Mexico. The best fit was obtained for a synthetic spectrum with: Teff = 15 000 K, log g = 3.5, [Fe/H] = 0, and vsini = 350 km s-1 (solid line). Two poorer fits calculated with different values of the rotational velocity, vsini = 300 km s-1 (dashed line) and vsini = 400 km s-1 (dash-dotted line), are shown for comparison purposes.
Current usage metrics show cumulative count of Article Views (full-text article views including HTML views, PDF and ePub downloads, according to the available data) and Abstracts Views on Vision4Press platform.
Data correspond to usage on the plateform after 2015. The current usage metrics is available 48-96 hours after online publication and is updated daily on week days.
Initial download of the metrics may take a while.