Fig. 10
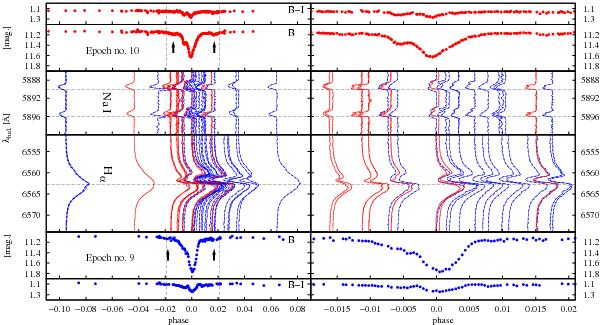
B and B − V light curves of the 2003 (bottom) and 2008/9 (top) eclipses. In the middle panel, we present all available line profiles of the Na i doublet and Hα for epoch 9 (superposition of two lines: thick dashed with thin solid) and 10 (solid line). The positions of the continuum levels refer to the orbital phases. The right-hand panels show a zoom of the central part of left-hand panels as indicated by vertical dashed lines. The arrows indicate the shallow minima in the external parts of the eclipses observed about 35 days before and after mid-eclipse at both last epochs (both last eclipses seem to be longer than expected and lasted about 90 days).
Current usage metrics show cumulative count of Article Views (full-text article views including HTML views, PDF and ePub downloads, according to the available data) and Abstracts Views on Vision4Press platform.
Data correspond to usage on the plateform after 2015. The current usage metrics is available 48-96 hours after online publication and is updated daily on week days.
Initial download of the metrics may take a while.