Fig. 1
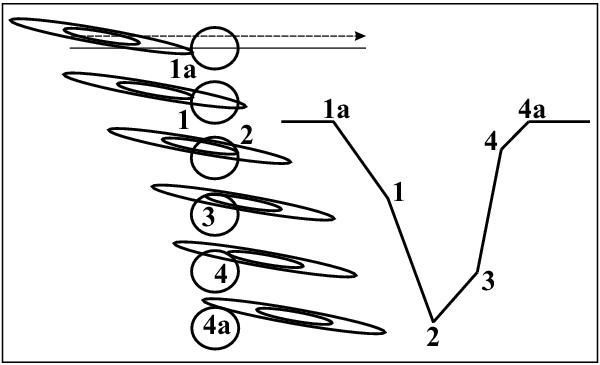
Schematic representation of the eclipse geometry in the EE Cep system. The inner opaque and outer semi-transparent regions of the disk are separated. The characteristic positions of the disk and the star configuration during the eclipses (left) correspond to the contact times (1a, 1, 2, 3, 4, 4a) distinguished in the light curve (right). The figure shows a highly simplified case that ignores a number of issues such as e.g. possible inhomogeneities in the distribution of brightness on the star’s surface or of the actual size of the disk.
Current usage metrics show cumulative count of Article Views (full-text article views including HTML views, PDF and ePub downloads, according to the available data) and Abstracts Views on Vision4Press platform.
Data correspond to usage on the plateform after 2015. The current usage metrics is available 48-96 hours after online publication and is updated daily on week days.
Initial download of the metrics may take a while.