| Issue |
A&A
Volume 543, July 2012
|
|
|---|---|---|
| Article Number | L1 | |
| Number of page(s) | 4 | |
| Section | Letters | |
| DOI | https://doi.org/10.1051/0004-6361/201219449 | |
| Published online | 21 June 2012 | |
The IRAM-30m line survey of the Horsehead PDR
I. CF+ as a tracer of C+ and as a measure of the fluorine abundance
1 IRAM, 300 rue de la Piscine, 38406 Saint Martin d’Hères France
e-mail: This email address is being protected from spambots. You need JavaScript enabled to view it.
; This email address is being protected from spambots. You need JavaScript enabled to view it.
; This email address is being protected from spambots. You need JavaScript enabled to view it.
2 LERMA – LRA, UMR 8112, Observatoire de Paris and École normale Supérieure, 24 rue Lhomond, 75231 Paris, France
e-mail: This email address is being protected from spambots. You need JavaScript enabled to view it.
3 Centro de Astrobiología, CSIC-INTA, Carretera de Ajalvir, Km 4, Torrejón de Ardoz, 28850 Madrid, Spain
e-mail: This email address is being protected from spambots. You need JavaScript enabled to view it.
4 LUTH UMR 8102, CNRS and Observatoire de Paris, Place J. Janssen, 92195 Meudon Cedex, France
e-mail: This email address is being protected from spambots. You need JavaScript enabled to view it.
5 European Space Astronomy Centre, ESA, PO Box 78, 28691 Villanueva de la Caada, Madrid, Spain
e-mail: This email address is being protected from spambots. You need JavaScript enabled to view it.
Received: 20 April 2012
Accepted: 2 June 2012
Abstract
C+ is a key species in the interstellar medium, but its 158 μm fine structure line cannot be observed from ground-based telescopes. Current models of fluorine chemistry predict that CF+ is the second-most important fluorine reservoir in regions where C+ is abundant. We detected the J = 1−0 and J = 2−1 rotational lines of CF+ with high signal-to-noise ratio toward the photo-dissociation region and dense core positions in the Horsehead. Using a rotational diagram analysis, we derive a column density of N(CF+) = (1.5−2.0) × 1012 cm-2. Because of the simple fluorine chemistry, the CF+ column density is proportional to the fluorine abundance. We thus infer the fluorine gas-phase abundance to be F/H = (0.6−1.5) × 10-8. Photochemical models indicate that CF+ is found in the layers where C+ is abundant. The emission arises in the UV-illuminated skin of the nebula, tracing the outermost cloud layers. Indeed, CF+ and C+ are the only species observed to date in the Horsehead with a double-peaked line profile caused by kinematics. We therefore propose that CF+, which is detectable from the ground, can be used as a proxy of the C+ layers.
Key words: astrochemistry / ISM: clouds / ISM: molecules / ISM: individual objects: Horsehead nebula / radio lines: ISM
© ESO, 2012
1. Introduction
C+ is a key species in the interstellar medium. First, it is an important tracer of the neutral gas where CO has not yet been able to form (Langer et al. 2010). Second, it is the dominant gas phase reservoir of carbon in the diffuse interstellar medium and its fine structure transition ( −
−  m, 1.9 THz) is the main cooling mechanism of the diffuse gas. Unfortunately, its rest-frame emission cannot be observed from ground-based telescopes. With Herschel and SOFIA it is now possible to observe this line from space and from the stratosphere, respectively, but with limited spatial resolution (12″ and 15″, respectively). It is therefore of great interest to find tracers of C+ that can be observed from the ground at much higher spatial resolution, for example with the Atacama Large Millimeter Array (ALMA) or the NOrthern Extended Millimeter Array (NOEMA).
The chemistry of fluorine was studied by Neufeld et al. (2005). Although there are still uncertainties in some reaction rate coefficients (e.g. CF+ photodissociation), the current models predict that CF+ is present in regions where C+ and HF are abundant, because it is produced by reactions between these species and destroyed mainly by electrons. In these regions CF+ is the second-most important fluorine reservoir after HF. The ground rotational transition of HF, which lies at THz frequencies, was first detected with the Herschel/HIFI in the diffuse interstellar medium through absorption measurements (Neufeld et al. 2010) and in emission in the Orion Bar (van der Tak et al. 2012). Neufeld et al. (2010) found a lower limit for the HF abundance of 6 × 10⁻⁹ relative to hydrogen nuclei, providing support to the theoretical prediction that HF is the dominant fluorine reservoir among a wide variety of interstellar conditions. Unlike HF and C+, CF+ rotational lines can be observed from the ground. However, up to now there has been only one detection of CF+ toward the Orion Bar (Neufeld et al. 2006).
In this Letter we report the detection of CF+ at the HCO and DCO+ peak emission, corresponding to the photo-dissociation region (PDR) and dense core environments in the Horsehead nebula, respectively (Pety et al. 2007; Gerin et al. 2009). We then infer the gas phase fluorine abundance.
Observation parameters for the maps.
2. Observations and data reduction
Figure 1 displays deep integrations of the J = 1−0 and J = 2−1 low-energy rotational lines of CF+ with the IRAM-30m telescope centered at the PDR and the dense core, located at (δRA, δDec) = (−5″,0″) and (20″,22″) with respect to the projection center, with 49 kHz spectral resolution at both frequencies. These observations were obtained as part of the Horsehead WHISPER project (Wideband High-resolution Iram-30m Surveys at two Positions with Emir Receivers). A presentation of the whole survey and the data reduction process will be given in Pety et al. (in prep.).
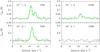 |
Fig. 1 Deep integrations toward the PDR and core positions. The green lines are double Gaussian fits. |
The CF+J = 1−0 and J = 2−1 maps displayed in Fig. 2 were observed simultaneously during seven hours of good winter weather (2 mm of precipitable water vapor) using the EMIR sideband-separation receivers at the IRAM-30m. We used the position-switching, on-the-fly observing mode. The off-position offsets were (δRA, δDec) = ( − 100″,0″), i.e. into the HII region ionized by σOri and free of molecular emission. We observed along and perpendicular to the direction of the exciting star in zigzags, covering an area of 100″ × 100″. A description of the HCO and DCO+ observations and data reductions, which are also displayed in Fig. 2, can be found in Gerin et al. (2009) and Pety et al. (2007). Table 1 summarizes the observation parameters for all these maps.
The maps were processed with the GILDAS1 softwares (Pety 2005). The IRAM-30m data were first calibrated to the  scale using the chopper-wheel method (Penzias & Burrus 1973), and finally converted into main-beam temperatures (Tmb) using the forward and main-beam efficiencies (Feff & Beff) displayed in Table 1. The resulting amplitude accuracy is ~10%. The resulting spectra were then baseline-corrected and gridded through convolution with a Gaussian to obtain the maps.
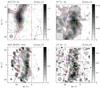 |
Fig. 2 Integrated intensity maps of the Horsehead edge. Maps were rotated by 14° counter-clockwise around the projection center, located at (δx,δy) = (20′′, 0′′), to bring the exciting star direction in the horizontal direction and the horizontal zero was set at the PDR edge, delineated by the red vertical line. The crosses show the positions of the PDR (green) and the dense core (blue). The spatial resolution is plotted in the bottom left corner. Values of the contour levels are shown in the color look-up table of each image (first contour at 2σ and 2.5σ for CF+1 − 0 and 2 − 1 respectively). The emission of all lines is integrated between 10.1 and 11.1 km s-1. |
3. Results
3.1. Line profiles
Two velocity peaks for the J = 1−0 line are clearly seen at both positions in Fig. 1. The second velocity peak is marginal for the J = 2−1 line. Table 2 presents the results of dual Gaussian fits. The centroid velocity of each peak is significantly shifted between the two CF+ transitions. We have carefully checked that neither peak is a residual line incompletely rejected from the image side band. This doubled-peak behavior is unexpected because all species without an hyperfine structure detected previously at millimeter wavelengths in the Horsehead present a simple velocity profile centered close to 10.7 km s-1. The only other species detected to date with a clear double peak emission profile is C+ toward the illuminated edge of the cloud (Herschel/HIFI, Teyssier et al., in prep.).
The most obvious explanation would be that the higher velocity peak corresponds to another line from another species. However, there are no other lines in the public line catalogs (Pickett et al. 1998; Müller et al. 2001) near this frequency besides CF+. Another possible explanation would be that the two peaks correspond to different hyperfine components that are caused by the fluorine nuclei. To our knowledge, there are no hyperfine structure studies on CF+. However, because the molecule is isoelectronic with CO, one can try to rely on 13CO spectroscopy since the nuclear spin of 13C is 1/2, as for the fluorine nucleus. The magnetic dipolar coupling constant scales approximately with the rotational constant and the magnetic moment of the nucleus for 1Σ electronic ground states (Reid & Chu 1974). This allows us to derive a coupling constant of approximately 110 kHz, and an hyperfine splitting of 165 kHz (110 kHz) for the J = 1−0 (J = 2−1) transitions, well below the observations. In addition, the respective intensities do not follow the theoretical predictions. Therefore, this possibility is unlikely. The profile is not caused by self-absorption because the CF+ opacities are low (τ ≲ 1). We therefore attribute the complex line profiles to kinematics in the CF+ emitting layers.
Gaussian fit results.
3.2. CF+ spatial distribution
Figure 2 presents the CF+, HCO and DCO+ integrated line intensity maps. The CF+ emission is concentrated toward the edge of the Horsehead, delineating the western edge of the DCO+ emission. A more extended and fainter emission is detected in the CF+ J = 1−0 map but not in the J = 2−1 map, which has a lower signal-to-noise ratio. The intensity peak of the CF+J = 1−0 line coincides with the intensity peak of the HCO emission (shown by the green cross), which traces the far-UV illuminated matter (Gerin et al. 2009). The J = 2−1 transition also peaks near the HCO emission peak.
We have checked that beam pick-up contamination from the PDR is negligible at the core position (<7%), even with the large beam size (~25″) of the 30 m at 102 GHz. The emission then arises in the line of sight toward the core but not necessarily in the cold gas associated with the core. Indeed, we expect the CF+ emission to arise in the outer layers of the nebula, delineating the edge as shown by the maps. This emission is likely to arise in the warmer and more diffuse material of the skin layers toward the core line of sight. Furthermore, there is a minimum of the emission in the CF+1 − 0 map toward the dense core position. This confirms that the CF+ emission is associated to the diffuse envelope. Molecular emission from the lower density cloud surface was already mentioned by Goicoechea et al. (2006) and Gerin et al. (2009) to explain the CS and HCO emission, respectively.
3.3. Column densities and abundances
The CF+ column density was estimated assuming that the emission is optically thin and that the emission fills the 30 m beam. We inferred an excitation temperature of 10 K, based on a rotational diagram built with the integrated line intensities of the two detected transitions. Assuming Tex = 10 K for all rotational levels, the beam averaged column density is ≃ (1.5−2.0) × 1012 cm-2 in the PDR. This value is similar to the column density found in the Orion Bar by Neufeld et al. (2006). In the next section, we will show that the CF+ emission arises at the illuminated edge of the nebula. Goicoechea et al. (2009a) found that the [O i]63 μm fine structure line, which also arises at the edge of the nebula, was best reproduced with a gas density of nH ≃ 104 cm-3. Thus, assuming this density and a cloud depth l ~ 0.1 pc (Habart et al. 2005), the CF+ column density translates into an abundance of ≃ (4.9−6.5) × 10-10 with respect to H nuclei. Taking the same excitation temperature of 10 K, we computed a column density toward the core of ≃ 4.4 × 1011 cm-2. We consider this as an upper limit for the model in Sect. 3.4 because CF+ is found in the surface layer, which is not taken into account by our unidimensional photochemical model.
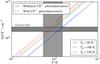 |
Fig. 3 Relation between the CF+ column density and F/H. |
3.4. CF+ chemistry
CF+ is formed through the following chemical path: ![Mathematical equation: \begin{eqnarray*} \textrm{F} + \hh &\xrightarrow[]{} \textrm{HF} + \textrm{H} \\ \textrm{HF} + \Cp &\xrightarrow[]{k_1} \CFp + \textrm{H} \end{eqnarray*}](/articles/aa/full_html/2012/07/aa19449-12/aa19449-12-eq65.png) and destroyed by dissociative recombination with electrons (Neufeld et al. 2006) and by far-UV photons:
and destroyed by dissociative recombination with electrons (Neufeld et al. 2006) and by far-UV photons: ![Mathematical equation: \begin{eqnarray*} \CFp + \textrm{e}^{-} &\xrightarrow[]{k_2} \textrm{C} + \textrm{F}\\ \CFp + h\nu &\xrightarrow[]{k_{\textrm{pd}}} \Cp + \textrm{F}. \end{eqnarray*}](/articles/aa/full_html/2012/07/aa19449-12/aa19449-12-eq66.png) The reactions rates are k1 = 7.2 × 10⁻⁹(T/300)-0.15 cm3 s-1 (Neufeld et al. 2005) and k2 = 5.3 × 10⁻⁸(T/300)-0.8 cm3 s-1 (Novotny et al. 2005). The CF+ photodissociation rate kpd is not known. Nevertheless, assuming a rate of 10-9 exp(−2.5 AV) s-1, we estimate that this contribution is negligible compared to the dissociative recombination in low far-UV field PDRs like the Horsehead. However, it might not be negligible in regions with high-radiation fields (χ ≃ 104−105), like the Orion Bar. In the following we therefore assumed that kpd = 0. Because 1) the fluorine chemistry is simple, 2) the electron abundance is given by the ionization of carbon n(e−) ~ n(C+) and 3) HF is the major reservoir of fluorine n(HF) ~ n(F), it can be shown that the CF+ column density is proportional to the fluorine gas phase abundance ([F] = F/H), i.e.
The reactions rates are k1 = 7.2 × 10⁻⁹(T/300)-0.15 cm3 s-1 (Neufeld et al. 2005) and k2 = 5.3 × 10⁻⁸(T/300)-0.8 cm3 s-1 (Novotny et al. 2005). The CF+ photodissociation rate kpd is not known. Nevertheless, assuming a rate of 10-9 exp(−2.5 AV) s-1, we estimate that this contribution is negligible compared to the dissociative recombination in low far-UV field PDRs like the Horsehead. However, it might not be negligible in regions with high-radiation fields (χ ≃ 104−105), like the Orion Bar. In the following we therefore assumed that kpd = 0. Because 1) the fluorine chemistry is simple, 2) the electron abundance is given by the ionization of carbon n(e−) ~ n(C+) and 3) HF is the major reservoir of fluorine n(HF) ~ n(F), it can be shown that the CF+ column density is proportional to the fluorine gas phase abundance ([F] = F/H), i.e. ![Mathematical equation: \begin{equation*} N(\CFp) \simeq \frac{k_1}{k_2} [\mathrm{F}]~\nH~l \hspace{0.5cm} \left[{\rm cm}^{-2}\right]. \end{equation*}](/articles/aa/full_html/2012/07/aa19449-12/aa19449-12-eq77.png) From our CF+ observations we find F/H ≃ (0.6−1.5) × 10-8 in the Horsehead PDR (see Fig. 3), in good agreement with the solar value (2.6 × 10⁻⁸; Asplund et al. 2009) and the one found in the diffuse atomic gas (1.8 × 10⁻⁸; Snow et al. 2007). Sonnentrucker et al. (2010) also derived F/H ≃ (0.5−0.8) × 10-8 in diffuse molecular clouds detected in absorption with the Herschel/HIFI.
From our CF+ observations we find F/H ≃ (0.6−1.5) × 10-8 in the Horsehead PDR (see Fig. 3), in good agreement with the solar value (2.6 × 10⁻⁸; Asplund et al. 2009) and the one found in the diffuse atomic gas (1.8 × 10⁻⁸; Snow et al. 2007). Sonnentrucker et al. (2010) also derived F/H ≃ (0.5−0.8) × 10-8 in diffuse molecular clouds detected in absorption with the Herschel/HIFI.
To understand the CF+ abundance profile as a function of depth, we used a one-dimensional, steady-state photochemical model (Meudon PDR code, Le Bourlot et al. 2012; Le Petit et al. 2006). The version of the Meudon PDR model we used includes the Langmuir Hinshelwood and Eley-Rideal mechanisms to describe the formation of H2 on grain surfaces. The physical conditions in the Horsehead have already been constrained by our previous observational studies and we kept the same assumptions for the steep density gradient (displayed in the upper panel of Fig. 4), radiation field (χ = 60 times the Draine 1978, mean interstellar radiation field), elemental gas-phase abundances (see Table 6 in Goicoechea et al. 2009b) and cosmic ray primary ionization rate (ζ = 5 × 10-17 s-1 per H2 molecule). We used the Ohio State University (osu) pure gas-phase chemical network, and included fluorine adsorption and desorption onto grains.
The predicted CF+, HF and C+ abundance profiles are shown in Fig. 4b. The HF and CF+ abundances decrease rapidly for AV > 1. The model agrees well with the observed CF+ abundance in the PDR, shown by the horizontal bars. The model predicts that there is a significant overlap between CF+ and C+. Moreover, the abundance ratio between these two species remains quite constant along the illuminated side of the cloud, i.e. AV < 4, as shown in Fig. 4c. The CF+ emission arises in the outermost layers of the cloud (AV ~ 0.5), which are directly exposed to the far-UV field, where the gas is less dense. The predicted spatial distribution of the CF+ emission is shown in Fig. 4d. We expect a narrow filament (~5″) shifted in the illuminated part of the PDR with respect to the HCO emission, which has already been shown to trace the far-UV illuminated molecular gas (Gerin et al. 2009).
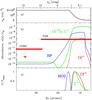 |
Fig. 4 Photochemical model of the Horsehead PDR. AV increases from right to left; the PDR edge, delineated by the red vertical line in Fig. 2, corresponds to AV = 0. a) Horsehead density profile nH = n(H) + 2n(H2). b) Predicted abundance of CF+ in red, HF in blue and C+ in green. The red horizontal bars show the measured CF+ abundances, and their length represents the beam size. c) Predicted intensity profiles. |
4. Conclusions
We have detected the J = 1−0 and J = 2−1 rotational lines of CF+ with high signal-to-noise ratio toward the PDR and
core positions in the Horsehead. We have also mapped the region, and found that the emission arises mostly at the illuminated edge of the nebula (PDR), but it is also detected toward the dense core arising from its lower density skin. CF+ is unique because its column density is proportional to the elemental abundance of fluorine. In the Horsehead PDR we found N ≃ (1.5−2.0) × 1012 cm-2 and inferred F/H ≃ (0.6−1.5) × 10-8. Our model of the fluorine chemistry predicts that CF+ accounts for 4−8% of all fluorine. CF+ is found in the layers where C+ is abundant because it is formed by reactions between HF and C+. In these regions the ionization fraction is high (see Goicoechea et al. 2009b) and CF+ destruction is dominated by dissociative recombination with electrons. The CF+ emission has two velocity components. The possibility that we are resolving the hyperfine structure is unlikely, but a corresponding theoretical or experimental study would allow us to derive the velocity structure unambiguously. Although the CF+ line profile is not exactly the same as the C+ line profile, they are the only species in the Horsehead with a double-peaked profile of kinematic origin measured to date. The complex line profile of both CF+ and C+ therefore confirms that they trace the gas directly exposed to the far-UV radiation, which shows a completely different kinematics than the following layers traced by other species, like HCO. We therefore propose that CF+ can be used as a proxy of the C+ layers that can be observed from the ground. We will check this by comparing our findings with a Herschel/HIFI map of the C+ emission in the Horsehead.
See http://www.iram.fr/IRAMFR/GILDAS for more information about the GILDAS softwares.
Acknowledgments
We thank the anonymous referee for useful comments that improved the Letter. V.G. acknowledges support from the Chilean Government through the Becas Chile scholarship program. This work was also funded by grant ANR-09-BLAN-0231-01 from the French Agence Nationale de la Recherche as part of the SCHISM project. J.R.G. thanks the Spanish MICINN for funding support through grants AYA2009-07304 and CSD2009-00038. J.R.G. is supported by a Ramón y Cajal research contract from the Spanish MICINN and co-financed by the European Social Fund.
References
- Asplund, M., Grevesse, N., Sauval, A. J., & Scott, P. 2009, ARA&A, 47, 481 [NASA ADS] [CrossRef] [Google Scholar]
- Draine, B. T. 1978, ApJS, 36, 595 [NASA ADS] [CrossRef] [Google Scholar]
- Gerin, M., Goicoechea, J. R., Pety, J., & Hily-Blant, P. 2009, A&A, 494, 977 [NASA ADS] [CrossRef] [EDP Sciences] [Google Scholar]
- Goicoechea, J. R., Pety, J., Gerin, M., et al. 2006, A&A, 456, 565 [NASA ADS] [CrossRef] [EDP Sciences] [Google Scholar]
- Goicoechea, J. R., Compiègne, M., & Habart, E. 2009a, ApJ, 699, L165 [NASA ADS] [CrossRef] [Google Scholar]
- Goicoechea, J. R., Pety, J., Gerin, M., Hily-Blant, P., & Le Bourlot, J. 2009b, A&A, 498, 771 [NASA ADS] [CrossRef] [EDP Sciences] [Google Scholar]
- Habart, E., Abergel, A., Walmsley, C. M., Teyssier, D., & Pety, J. 2005, A&A, 437, 177 [NASA ADS] [CrossRef] [EDP Sciences] [Google Scholar]
- Langer, W. D., Velusamy, T., Pineda, J. L., et al. 2010, A&A, 521, L17 [Google Scholar]
- Le Bourlot, J., Le Petit, F., Pinto, C., Roueff, E., & Roy, F. 2012, A&A, 541, A76 [NASA ADS] [CrossRef] [EDP Sciences] [Google Scholar]
- Le Petit, F., Nehmé, C., Le Bourlot, J., & Roueff, E. 2006, ApJS, 164, 506 [NASA ADS] [CrossRef] [EDP Sciences] [Google Scholar]
- Müller, H. S. P., Thorwirth, S., Roth, D. A., & Winnewisser, G. 2001, A&A, 370, L49 [NASA ADS] [CrossRef] [EDP Sciences] [Google Scholar]
- Neufeld, D. A., Wolfire, M. G., & Schilke, P. 2005, ApJ, 628, 260 [NASA ADS] [CrossRef] [Google Scholar]
- Neufeld, D. A., Schilke, P., Menten, K. M., et al. 2006, A&A, 454, L37 [NASA ADS] [CrossRef] [EDP Sciences] [Google Scholar]
- Neufeld, D. A., Sonnentrucker, P., Phillips, T. G., et al. 2010, A&A, 518, L108 [NASA ADS] [CrossRef] [EDP Sciences] [Google Scholar]
- Novotny, O., Mitchell, J. B. A., LeGarrec, J. L., et al. 2005, J. Phys. B At. Mol. Phys., 38, 1471 [NASA ADS] [CrossRef] [Google Scholar]
- Penzias, A. A., & Burrus, C. A. 1973, ARA&A, 11, 51 [NASA ADS] [CrossRef] [Google Scholar]
- Pety, J. 2005, in SF2A-2005: Semaine de l’Astrophysique Française, ed. F. Casoli, T. Contini, J. M. Hameury, & L. Pagani, 721 [Google Scholar]
- Pety, J., Goicoechea, J. R., Hily-Blant, P., Gerin, M., & Teyssier, D. 2007, A&A, 464, L41 [NASA ADS] [CrossRef] [EDP Sciences] [Google Scholar]
- Pickett, H. M., Poynter, R. L., Cohen, E. A., et al. 1998, J. Quant. Spec. Radiat. Transf., 60, 883 [Google Scholar]
- Reid, R. V., & Chu, A. H.-M. 1974, Phys. Rev. A, 9, 609 [NASA ADS] [CrossRef] [Google Scholar]
- Snow, T. P., Destree, J. D., & Jensen, A. G. 2007, ApJ, 655, 285 [NASA ADS] [CrossRef] [Google Scholar]
- Sonnentrucker, P., Neufeld, D. A., Phillips, T. G., et al. 2010, A&A, 521, L12 [NASA ADS] [CrossRef] [EDP Sciences] [Google Scholar]
- van der Tak, F. F. S., Ossenkopf, V., Nagy, Z., et al. 2012, A&A, 537, L10 [NASA ADS] [CrossRef] [EDP Sciences] [Google Scholar]
All Tables
All Figures
|
Fig. 1 Deep integrations toward the PDR and core positions. The green lines are double Gaussian fits. |
| In the text | |
|
Fig. 2 Integrated intensity maps of the Horsehead edge. Maps were rotated by 14° counter-clockwise around the projection center, located at (δx,δy) = (20′′, 0′′), to bring the exciting star direction in the horizontal direction and the horizontal zero was set at the PDR edge, delineated by the red vertical line. The crosses show the positions of the PDR (green) and the dense core (blue). The spatial resolution is plotted in the bottom left corner. Values of the contour levels are shown in the color look-up table of each image (first contour at 2σ and 2.5σ for CF+1 − 0 and 2 − 1 respectively). The emission of all lines is integrated between 10.1 and 11.1 km s-1. |
| In the text | |
|
Fig. 3 Relation between the CF+ column density and F/H. |
| In the text | |
|
Fig. 4 Photochemical model of the Horsehead PDR. AV increases from right to left; the PDR edge, delineated by the red vertical line in Fig. 2, corresponds to AV = 0. a) Horsehead density profile nH = n(H) + 2n(H2). b) Predicted abundance of CF+ in red, HF in blue and C+ in green. The red horizontal bars show the measured CF+ abundances, and their length represents the beam size. c) Predicted intensity profiles. |
| In the text | |
Current usage metrics show cumulative count of Article Views (full-text article views including HTML views, PDF and ePub downloads, according to the available data) and Abstracts Views on Vision4Press platform.
Data correspond to usage on the plateform after 2015. The current usage metrics is available 48-96 hours after online publication and is updated daily on week days.
Initial download of the metrics may take a while.