Fig. 4
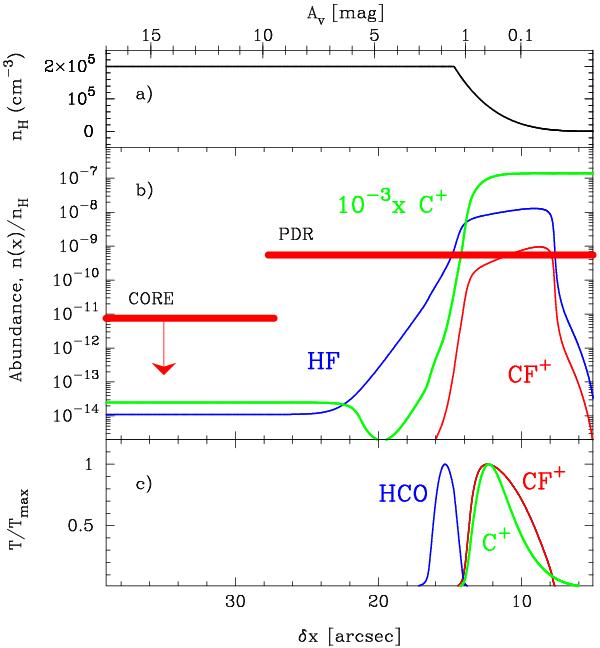
Photochemical model of the Horsehead PDR. AV increases from right to left; the PDR edge, delineated by the red vertical line in Fig. 2, corresponds to AV = 0. a) Horsehead density profile nH = n(H) + 2n(H2). b) Predicted abundance of CF+ in red, HF in blue and C+ in green. The red horizontal bars show the measured CF+ abundances, and their length represents the beam size. c) Predicted intensity profiles.
Current usage metrics show cumulative count of Article Views (full-text article views including HTML views, PDF and ePub downloads, according to the available data) and Abstracts Views on Vision4Press platform.
Data correspond to usage on the plateform after 2015. The current usage metrics is available 48-96 hours after online publication and is updated daily on week days.
Initial download of the metrics may take a while.