Free Access
Fig. 5
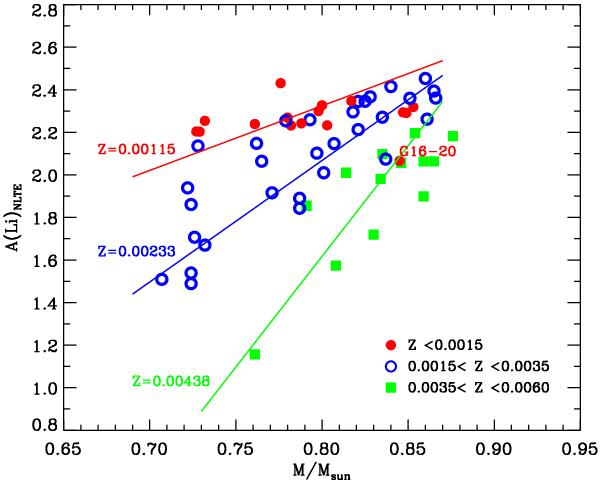
Li abundances as a function of stellar mass for stars with 0.70 < M/M⊙ < 0.90 and Z < 0.006. For each of the three Z-intervals, the fit given in Eq. (2) is shown as a straight line corresponding to the mean value of Z for the group indicated at the line.
Current usage metrics show cumulative count of Article Views (full-text article views including HTML views, PDF and ePub downloads, according to the available data) and Abstracts Views on Vision4Press platform.
Data correspond to usage on the plateform after 2015. The current usage metrics is available 48-96 hours after online publication and is updated daily on week days.
Initial download of the metrics may take a while.