Free Access
Fig. 3
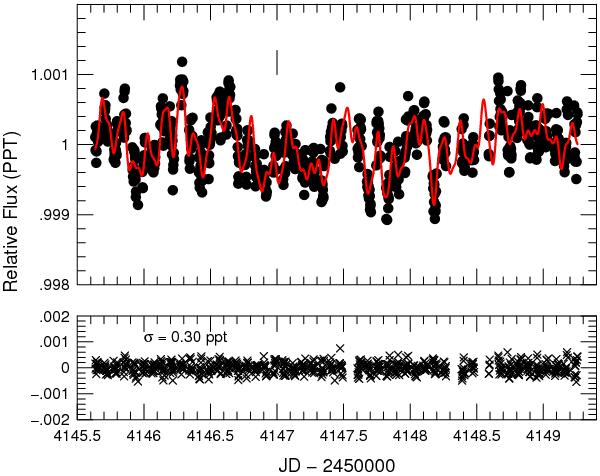
(Top) Photometry of β Gem taken with the MOST micro-satellite. The solid line represents the fit to the data using the frequencies and amplitudes in Table 4. (Bottom) Residuals after subtracting the fit. Units are in parts per thousand (PPT).
Current usage metrics show cumulative count of Article Views (full-text article views including HTML views, PDF and ePub downloads, according to the available data) and Abstracts Views on Vision4Press platform.
Data correspond to usage on the plateform after 2015. The current usage metrics is available 48-96 hours after online publication and is updated daily on week days.
Initial download of the metrics may take a while.