Fig. 1
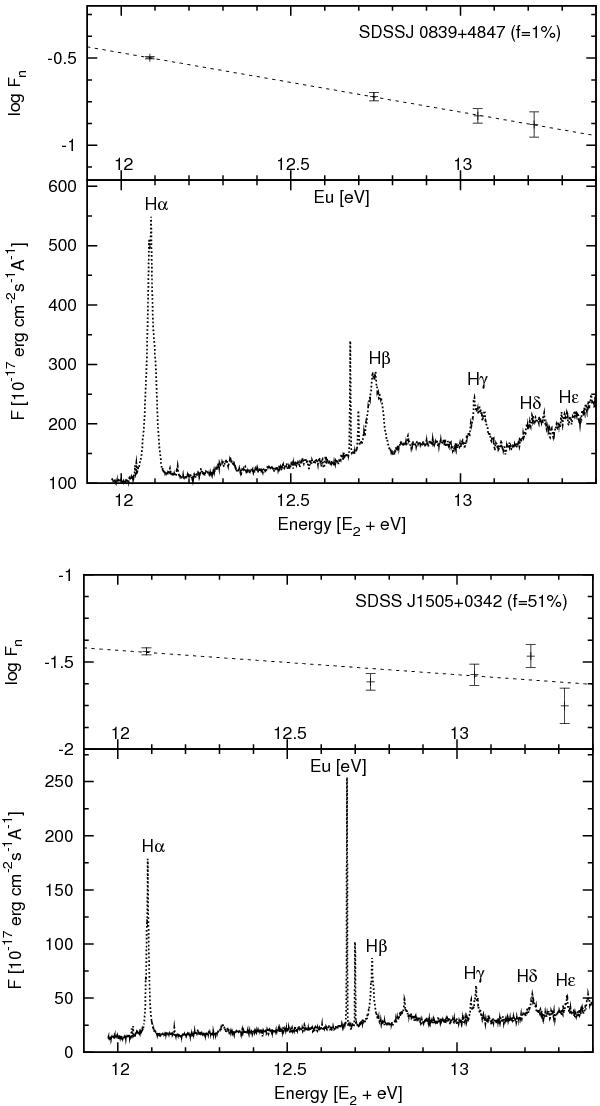
Examples of AGNs where the BP method works (upper panel) and where it does not give valid results (bottom panel) applied to the data taken from La Mura et al. (2007). Each panel contains the observed spectrum and the BP applied to the line fluxes of the Balmer series (only the broad component of the Balmer lines was used). For the lower plots, which give the observed spectra, the observed wavelength scale (x-axis) is converted into energy units (eV), according to the energy above the ground of the upper transition levels, to match the BP in the upper plots.
Current usage metrics show cumulative count of Article Views (full-text article views including HTML views, PDF and ePub downloads, according to the available data) and Abstracts Views on Vision4Press platform.
Data correspond to usage on the plateform after 2015. The current usage metrics is available 48-96 hours after online publication and is updated daily on week days.
Initial download of the metrics may take a while.