Fig. 4
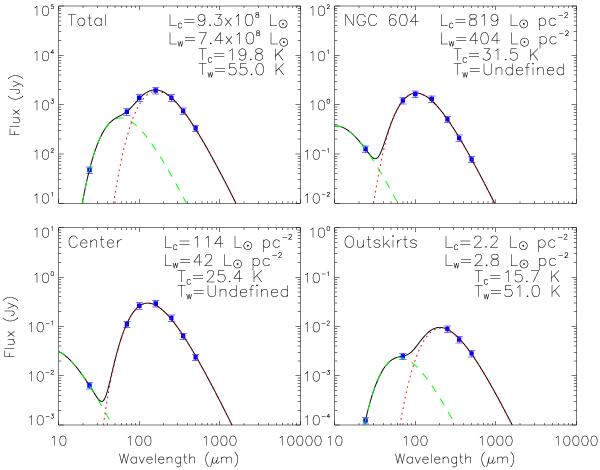
Spectral energy distributions for the total galaxy (upper left panel) and a typical HII region (upper right – center of NGC 604), as well as the center of the galaxy (lower left panel) and the “diffuse” outer part of the galaxy (lower right panel). The emission was modeled with two modified blackbodies of β = 1.5 and fitted to the MIPS 24 and 70 μm, PACS 100 and 160 μm, and SPIRE 250, 350, and 500 μm observations. For the bright parts of the galaxy (around the center and in bright HII regions), it is evident that the specific model is unable to accurately describe the data giving unphysically high temperatures for the “warm” dust component. In the text, we describe two different and more reliable methods to derive the properties of the “warm” dust component (see Sect. 4.1 for more details).
Current usage metrics show cumulative count of Article Views (full-text article views including HTML views, PDF and ePub downloads, according to the available data) and Abstracts Views on Vision4Press platform.
Data correspond to usage on the plateform after 2015. The current usage metrics is available 48-96 hours after online publication and is updated daily on week days.
Initial download of the metrics may take a while.