Free Access
Fig. 2
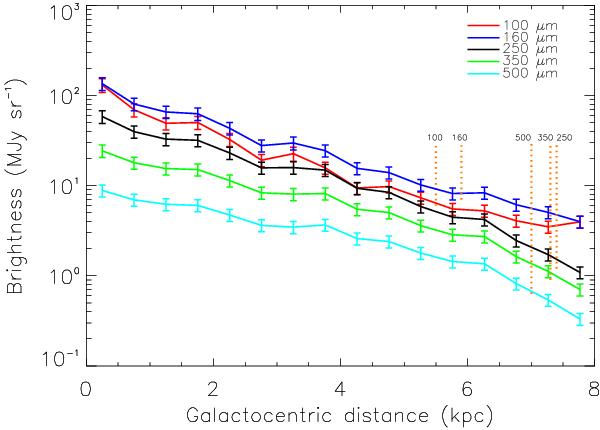
Azimuthally averaged radial profiles, projected onto the major axis of M 33 for the 100, 160, 250, 350, and 500 μm emission (red, blue, black, green, and cyan colors, respectively). The vertical dotted lines (in orange color) indicate the 3-σ flux level threshold for each wavelength.
Current usage metrics show cumulative count of Article Views (full-text article views including HTML views, PDF and ePub downloads, according to the available data) and Abstracts Views on Vision4Press platform.
Data correspond to usage on the plateform after 2015. The current usage metrics is available 48-96 hours after online publication and is updated daily on week days.
Initial download of the metrics may take a while.