Fig. 12
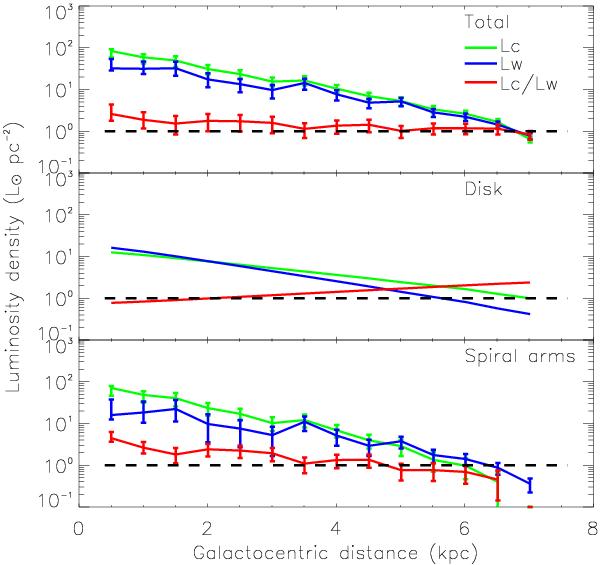
The azimuthally averaged profiles of the “cool” and the “warm” dust luminosities (green and blue lines) in units of L⊙ pc-2. The cool-to-warm luminosity ratio is also plotted (red line). The luminosities are calculated for the whole galaxy (upper panel) and the disk of the galaxy only (middle panel; see Sect. 6.2). The residuals between the two profiles give the radial distribution of the luminosity produced by the spiral arm network (bottom panel).
Current usage metrics show cumulative count of Article Views (full-text article views including HTML views, PDF and ePub downloads, according to the available data) and Abstracts Views on Vision4Press platform.
Data correspond to usage on the plateform after 2015. The current usage metrics is available 48-96 hours after online publication and is updated daily on week days.
Initial download of the metrics may take a while.