Fig. 11
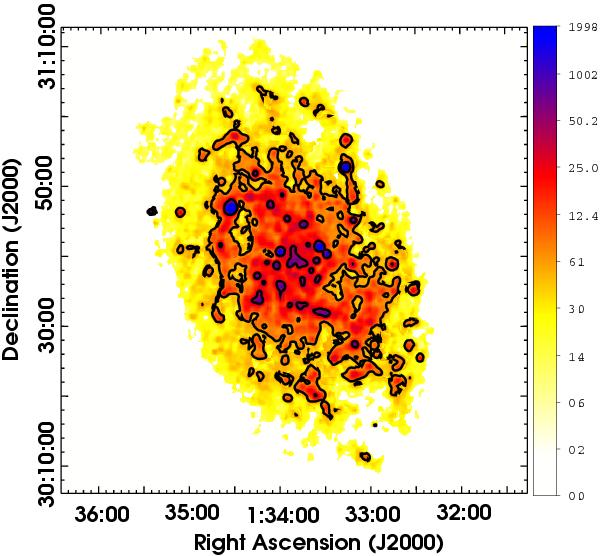
The luminosity map of M 33 produced by the “warm” dust grains. Luminosities fainter than 6 L⊙ pc-2 (yellow areas) are found in the outer diffuse parts of the galaxy, while higher luminosities trace the spiral arms (orange/red regions). The highest luminosity densities (>40 L⊙ pc-2; innermost contours; blue areas) are produced in the bright HII regions and the center of the galaxy. The “constant” interpolation method was used to estimate the “warm” dust luminosities.
Current usage metrics show cumulative count of Article Views (full-text article views including HTML views, PDF and ePub downloads, according to the available data) and Abstracts Views on Vision4Press platform.
Data correspond to usage on the plateform after 2015. The current usage metrics is available 48-96 hours after online publication and is updated daily on week days.
Initial download of the metrics may take a while.