Fig. 1
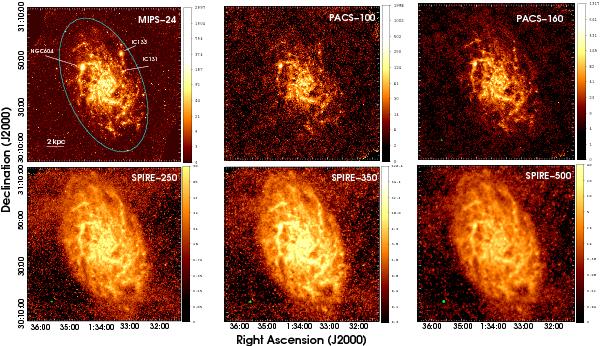
Spitzer MIPS-24 μm (upper left panel), Herschel PACS-100 and 160 μm (upper middle and right panels, respectively) and SPIRE-250, 350, and 500 μm (lower left, middle and right panels, respectively). All maps are at their original resolution, and the FWHM of the beams (6′′, 6.7″ × 6.9″, 10.7″ × 11.1″, 18.3″ × 17.0″, 24.7″ × 23.2″, and 37.0″ × 33.4″ for 24, 100, 160, 250, 350, and 500 μm respectively) are indicated as green circles at the bottom-left part in each panel. In the MIPS-24 μm map, three of the brightest HII regions are labeled for reference. The outer ellipse shows the B-band D25 (semi-major axis length = 7.5 kpc; Paturel et al. 2003) extent of the galaxy. The brightness scale is given in units of MJy sr-1.
Current usage metrics show cumulative count of Article Views (full-text article views including HTML views, PDF and ePub downloads, according to the available data) and Abstracts Views on Vision4Press platform.
Data correspond to usage on the plateform after 2015. The current usage metrics is available 48-96 hours after online publication and is updated daily on week days.
Initial download of the metrics may take a while.