Fig. 7
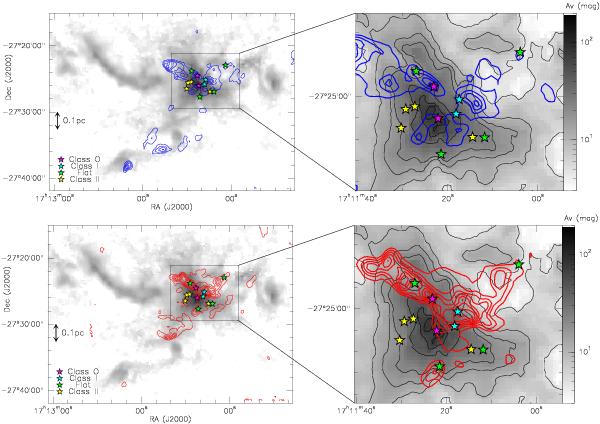
12CO outflow emission in B59 shown as blue and red contours, together with the YSOs positions plotted on the extinction map from Fig. 1 in gray scale (and black contours on the righthand panels). The lefthand panels show the high velocity emission over the entire B59 region, while the right panels show a zoom into the central star-forming core. The 12CO emission was integrated from −5 to 2.7 km s-1 (blue) and from 4.2 to 15 km s-1 (red). The contours are from 3 K km s-1 on the left panels and from 4 K km s-1 on the right panels, in steps of 2 K km s-1.
Current usage metrics show cumulative count of Article Views (full-text article views including HTML views, PDF and ePub downloads, according to the available data) and Abstracts Views on Vision4Press platform.
Data correspond to usage on the plateform after 2015. The current usage metrics is available 48-96 hours after online publication and is updated daily on week days.
Initial download of the metrics may take a while.