Fig. 6
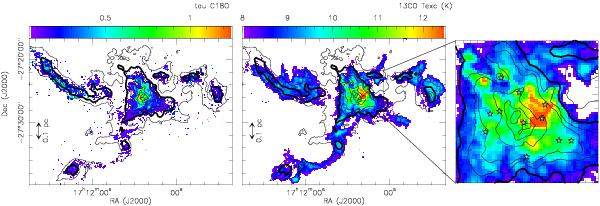
Left: colour scale map of the C18O opacity calculated from the ratio of 13CO to C18O emission. The C18O optical depth is less than 0.5 in most of the cloud and only in the central B59 core it rises to higher values, with three local peaks where it reaches values around unity. Centre and right: 13CO excitation temperature map in colour scale. This shows an increase of temperature towards the central B59 (zoomed in on the right panel). In all panels, the contours are the dust extinction as in Fig. 1. The darker contour at Av = 10 which delineates the regions most likely to be in LTE.
Current usage metrics show cumulative count of Article Views (full-text article views including HTML views, PDF and ePub downloads, according to the available data) and Abstracts Views on Vision4Press platform.
Data correspond to usage on the plateform after 2015. The current usage metrics is available 48-96 hours after online publication and is updated daily on week days.
Initial download of the metrics may take a while.