Fig. 2
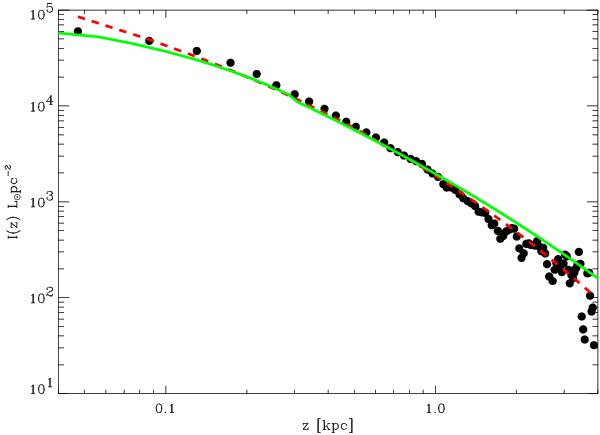
Here we plot the projected luminosity against projected radius along the minor axis of NGC 7814. The data points come from FSK11 and their fitted model is the red dashed line. The green solid line is our model, which is not a fit, but rather is the projected luminosity profile fit of the major axis squashed by the axis ratio, q, which is determined from fitting the surface brightness contours of Fig. 3.
Current usage metrics show cumulative count of Article Views (full-text article views including HTML views, PDF and ePub downloads, according to the available data) and Abstracts Views on Vision4Press platform.
Data correspond to usage on the plateform after 2015. The current usage metrics is available 48-96 hours after online publication and is updated daily on week days.
Initial download of the metrics may take a while.