Fig. 1
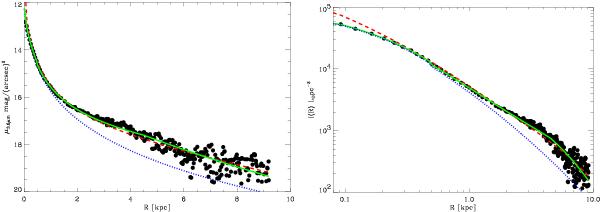
In the left hand panel we plot surface brightness against projected radius along the major axis of NGC 7814. The data points come from FSK11 and their fitted model is the red dashed line. Our model, using the combined luminosity of the bulge and disk, is the green solid line and the blue dotted line is the surface brightness of our fitted bulge only. The right hand panel shows the projected luminosity against projected radius along the major axis. The fitted models are the same as in the left hand panel.
Current usage metrics show cumulative count of Article Views (full-text article views including HTML views, PDF and ePub downloads, according to the available data) and Abstracts Views on Vision4Press platform.
Data correspond to usage on the plateform after 2015. The current usage metrics is available 48-96 hours after online publication and is updated daily on week days.
Initial download of the metrics may take a while.